

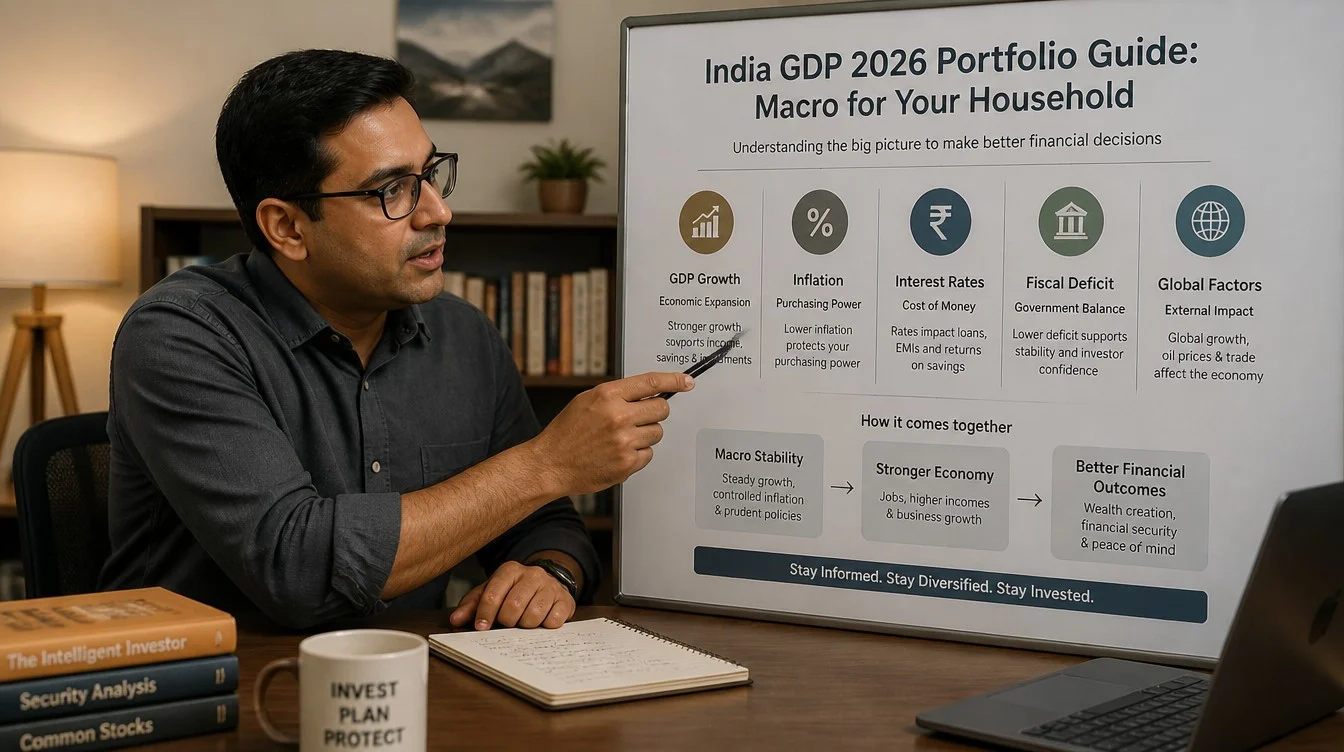
India’s GDP growth in 2026 remains among the highest of the major economies, with MoSPI and Ministry of Finance projections continuing to show real GDP expansion materially above the United States, the European Union, and most other large economies. For a salaried Indian household, the macro picture is not a topic for cocktail conversation; it is the underlying engine that determines the long-term return on equity SIPs, the trajectory of the rupee against the dollar, the demand for real estate, and the inflation that erodes savings. Understanding the connection between india gdp 2026 portfolio implications and the household’s specific allocation decisions converts macro noise into a useful framework for the annual review.
This guide walks through where India’s GDP growth sits relative to the US, China, and the European Union in 2026, the structural transmission from GDP growth to equity returns, the rupee, and real estate, and a small set of rebalance triggers that link macro moves to actual household decisions. Market-linked instruments carry market risk; read scheme-related documents carefully before extrapolating future returns from current macro snapshots.
The GDP Snapshot in Mid-2026
The starting point is a clean view of India’s GDP growth versus the major global economies.
The indicative picture
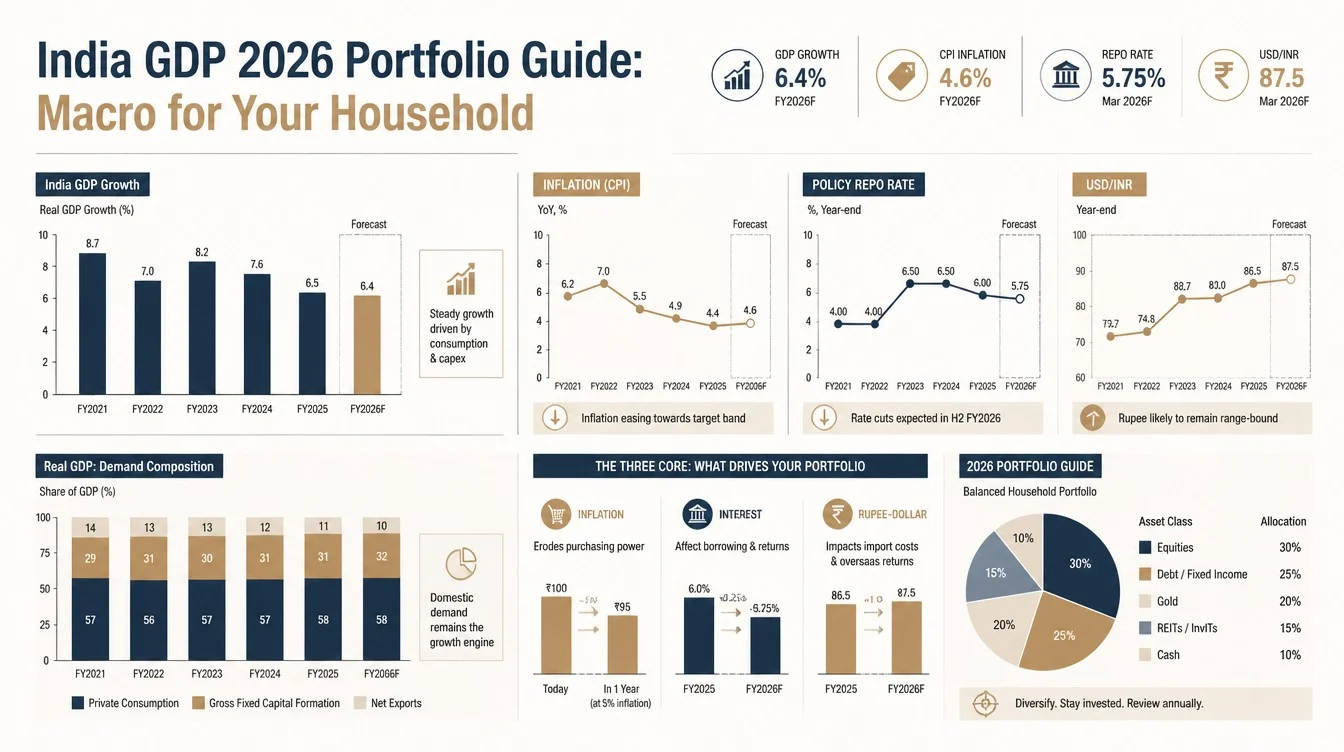
India’s real GDP growth has continued to print in the upper-6 to lower-7 percent range in FY 2025-26 per MoSPI and Ministry of Finance projections, supported by domestic consumption, services-sector strength, and a steady pace of public investment. The growth is well above the United States (typically printing in the lower single digits), the European Union (in similar territory), and is competitive with or moderately below China’s official prints (which have been in the 4 to 5 percent range in recent years).
The composition of Indian growth
Indian growth is increasingly driven by services (IT, financial services, telecom, retail) and consumption, with manufacturing growing but at a slower pace than services. Public capex has played a meaningful role in the post-2020 cycle. The composition matters for the equity-market response because sectors aligned with the growth driver tend to outperform those dependent on the laggard segments.
The “fastest large economy” framing
The framing of India as the fastest-growing large economy is supported by multiple measurement sources (IMF, World Bank, OECD). The framing matters because it influences foreign investor flows, which in turn influence equity valuations and the rupee. The dependency on the framing also means that any growth slowdown gets weighted heavily by the same flows.
The “demographic dividend” supporting growth
India’s working-age population continues to expand for the next 15 to 20 years per Census-based projections, while most major economies face workforce contraction. The demographic differential is the structural underpinning of why India’s medium-term growth potential is meaningfully above global averages. The dividend translates into return only if the workforce finds productive employment, which is the main growth-execution question.
The India vs Global Comparison Table
The table below provides an indicative comparison across the major large economies in 2026. Exact numbers vary by source and revision; the broad ordering is robust.
| Economy | Indicative real GDP growth 2026 | Structural drivers |
|---|---|---|
| India | Around 6 to 7 percent | Domestic consumption, services, public capex, demographic dividend |
| China | Around 4 to 5 percent (official prints) | Investment-led growth maturing; consumption transition under way; property-sector drag |
| United States | Around 1.5 to 2.5 percent | Services, technology, consumption; demographics neutral to negative |
| European Union | Around 0.5 to 1.5 percent | Mature economy; demographic headwind; energy transition costs |
| Japan | Around 0.5 to 1 percent | Mature economy; declining workforce; structural deflation risks |
| Brazil | Around 2 to 3 percent | Commodity exposure; domestic-policy variability |
| Indonesia | Around 4 to 5 percent | Demographic dividend; commodity exposure; consumption growth |
The growth differential and the discount-rate implication
A sustained growth differential of 3 to 5 percentage points between India and the developed economies has implications for discount rates used to value equities. Higher expected growth supports higher acceptable P/E ratios on Indian equity, though current Indian valuations relative to history and to other emerging markets also need to be evaluated separately. Indian equity is not perpetually cheap because growth is higher; it is sometimes cheap, sometimes expensive, with the growth differential being one input among several.
The earnings-growth translation
Nominal GDP growth (real growth plus inflation) sets the rough ceiling for aggregate corporate earnings growth over multi-year periods. With India at nominal GDP growth of approximately 11 to 13 percent (real plus inflation), corporate earnings growth in the high single digits to low double digits is structurally consistent. Equity returns over very long periods are anchored by earnings growth plus dividend yield, with valuation changes layered on top.
The rupee implication
Higher Indian growth supports foreign capital flows, which generally supports the rupee. The rupee has nonetheless depreciated against the US dollar over multi-decade periods, reflecting the inflation differential and the structural current-account-deficit pattern. The depreciation rate has been roughly 2 to 4 percent per year on average, with significant year-to-year variation.

The Equity-Market Linkage
The transmission from GDP growth to Indian equity returns runs through corporate earnings, valuation multiples, and foreign flows.
The earnings channel
Indian-listed companies derive the majority of their revenue from domestic Indian demand. A 6 to 7 percent real GDP growth, combined with 5 to 6 percent inflation, produces nominal GDP growth of 11 to 13 percent. A typical Nifty 50 company’s earnings growth roughly tracks nominal GDP growth over multi-year periods, with cyclical variation around the trend.
The valuation channel
Equity-market valuations (P/E ratios, P/B ratios) reflect both the expected earnings growth and the discount rate applied to those earnings. The discount rate is influenced by the G-Sec yield (the risk-free rate) and the equity risk premium demanded by investors. When G-Sec yields rise, equity valuations face downward pressure from the discount-rate channel even if earnings growth is unchanged.
The foreign-flow channel
Foreign Portfolio Investor (FPI) flows are a meaningful driver of Indian equity-market liquidity. FPI flows are influenced by the India-vs-other-emerging-market growth differential, the rupee’s expected path, global risk appetite, and US monetary policy. The flows are volatile in the short term but have generally been positive over long periods, reflecting the structural growth story.
The implication for the household equity SIP
The long-term equity SIP into Indian broad-market funds or large-cap funds is structurally aligned with the growth story. Short-term valuation cycles, FPI flow reversals, and macro surprises do not derail the long-term thesis if the SIP is maintained through cycles. The disciplined SIP is the simplest and most effective way for a salaried household to capture the structural growth.
The Rupee, Real Estate, and Other Linkages
Beyond equity, the macro picture affects several other parts of the household balance sheet.
The rupee path
The rupee has depreciated against the US dollar over multi-decade periods, reflecting the inflation differential and structural balance-of-payments dynamics. A salaried household with foreign-currency liabilities or goals (children’s overseas education, planned migration, foreign property) is structurally exposed to rupee weakness on the cost side. A small global-equity allocation (5 to 15 percent of the portfolio) provides a partial natural hedge.
The real-estate market
Indian real-estate values, especially in Tier-1 and Tier-2 cities, have historically tracked nominal GDP growth over multi-decade periods, with significant city- and segment-level variation. A 6 to 7 percent real growth plus 5 to 6 percent inflation implies a long-term real-estate appreciation in the high single digits, before transaction costs. The actual realised return depends heavily on location, segment, holding period, and rental yield.
The fixed-income environment
A growing economy with controlled inflation supports steady policy-rate management and stable fixed-income markets. Periods of growth slowdown or inflation overshoot produce rate-cycle moves that affect bond-fund NAVs and home-loan EMIs. The MPC’s stance, which reflects the macro picture, is therefore a leading indicator for fixed-income decisions.
The inflation overlay
India’s headline inflation in the post-COVID cycle has generally been within the 4 plus or minus 2 percent target band set by the MPC, with occasional excursions above. Inflation persistently above target erodes the real value of savings held in low-yielding instruments and reinforces the case for an equity-heavy long-term allocation that has a structural inflation-beating tendency.

Rebalance Triggers Linked to Macro Moves
The household does not need to trade macro moves, but it does benefit from a small set of mechanical triggers that link macro changes to specific allocation decisions.
Trigger 1: G-Sec yield moves significantly
If the 10-year G-Sec yield moves by more than 100 basis points (a meaningful threshold) from the household’s last review, that is a trigger to review the fixed-income allocation. A material rise in yields makes G-Sec direct ownership and long-duration bond funds more attractive; a material fall makes the opposite case. The mechanical action is a rebalance toward the new opportunity set, not a wholesale shift.
Trigger 2: Equity valuations cross multi-year extremes
If the Nifty 50 P/E ratio or other valuation metric crosses 1.5 standard deviations above or below the long-term average, that is a soft trigger to review the equity allocation. The action is small (a 5 to 10 percent rebalance, not a wholesale shift) and respects the long-term thesis without ignoring multi-year valuation extremes.
Trigger 3: Rupee moves by a large amount
A rupee depreciation of more than 5 percent in a year, or a similar appreciation, can trigger a review of the global-equity allocation. Depreciation makes existing global-equity holdings more valuable in rupee terms and may justify trimming; appreciation makes the opposite case. The discipline is to act on the rebalance trigger rather than on the headline.
Trigger 4: A major policy shift
A structural policy change (a Union Budget that materially shifts tax rules, an RBI framework change, a regulatory tightening on a specific asset class) can trigger a focused review of the affected allocations. The action is targeted rather than systemic. The household’s long-term asset allocation rarely needs to change because of a single policy event, but specific instruments within an allocation may.
Building a Macro-Aware Household Portfolio
The macro picture should inform the household’s long-term asset allocation without driving short-term trading.
The growth-tilted core
An Indian household with a 10+ year horizon can support an equity-heavy core allocation, split across the three sleeves below.
- Indian large-cap and multi-cap equity, typically the largest single share of the equity sleeve.
- Indian mid-cap and small-cap equity in proportion to risk tolerance and horizon.
- A small global-equity allocation for currency and sector diversification.
The combined equity weight is typically 60 to 75 percent of the long-term portfolio, depending on age and risk tolerance. The growth-tilted core captures the demographic and macro story over time.
The fixed-income anchor
The fixed-income sleeve (15 to 30 percent of the long-term portfolio depending on age and risk tolerance) provides stability and dry powder for rebalancing. Sovereign-credit instruments (G-Secs, G-Sec funds) form the cleanest core of this sleeve; corporate bonds and dynamic-bond funds add some yield enhancement at modest credit-risk premiums.
The global diversification sleeve
A small global equity allocation (5 to 15 percent, depending on appetite and route availability) provides currency diversification and exposure to sectors and themes that are underrepresented in Indian markets (US technology, global pharma, global energy). The route choice (Indian-domiciled international MF, GIFT City feeder, direct LRS) depends on the household’s complexity tolerance.
The annual macro review
Once a year, ideally in April after the previous financial year closes, review the household’s allocation against the latest GDP, inflation, and rate-cycle picture. The review is qualitative rather than quantitative for most households: are the allocations broadly consistent with the macro environment, do any specific triggers above apply, and is the overall portfolio still aligned with the long-term financial plan.
Common Mistakes Households Make on Macro
The handful of mistakes most often made by retail investors trying to integrate macro into their portfolio.
Trading on a single GDP print
A single quarterly GDP release that surprises positively or negatively is rarely a basis for portfolio action. The household’s long-term allocation should not move on a quarter’s data; the trend across multiple quarters is the relevant signal. Reactivity to a single print is the source of most macro-driven retail trading errors.
Assuming high growth automatically means high equity returns
Growth and stock-market returns are correlated but not identical. The starting valuation, the path of inflation, the currency, and the policy environment all matter. A high-growth economy with very high starting valuations can produce muted equity returns even as the economy grows. Long-term Indian equity has rewarded patient investors well, but the path includes phases where high growth and modest returns coexisted.
Avoiding global diversification because India is growing fastest
The “Indian growth is highest, so global diversification is unnecessary” argument is intuitively appealing but structurally weak. Global diversification provides currency, sector, and tail-risk hedges that pure-India portfolios cannot. The right global allocation is small (5 to 15 percent), not zero.
Over-reacting to global headlines
Many retail investors react to US Federal Reserve moves, global recession headlines, or geopolitical events by adjusting their Indian-equity allocation. The Indian economy and Indian equity markets, while not insulated, have their own drivers (domestic consumption, policy, demographics). Long-term Indian SIPs should largely ignore global noise.
FAQ
If India is growing faster than the rest of the world, should I have 100 percent of my equity in India?
No. Even given India’s structural growth advantage, a small global equity allocation (typically 5 to 15 percent of the equity sleeve) provides currency, sector, and tail-risk diversification benefits that pure-India portfolios cannot replicate. Global allocation is not a bet against India; it is a hedge against the inevitable concentration risk that a single-country portfolio carries. The right level depends on the household’s overall context, but zero global allocation is rarely the right answer for a long-term portfolio.
How does India’s GDP growth affect my home loan?
Indirectly, through the inflation, MPC policy, and G-Sec yield path. A growth-positive, inflation-controlled environment supports lower policy rates over time, which translates into lower EBLR-based home-loan rates. A growth slowdown with persistent inflation produces the opposite. The transmission lag is months to quarters, and individual home-loan rates also reflect the borrower’s credit profile and the bank’s spread.
Should I shift my real estate allocation based on GDP growth?
Real estate is illiquid and has high transaction costs; it is rarely a tactical asset class. The decision to buy or sell real estate should be driven primarily by the household’s specific needs (a home to live in, a goal-tied investment, a planned move) rather than by GDP-trend analysis. Where the household has flexibility, a strong growth period combined with reasonable real-estate valuations relative to long-term metrics (price-to-rent, price-to-income) can support adding exposure.
Does India’s high GDP growth mean my SIP returns will be high?
Higher growth supports higher earnings growth, which is a key driver of long-term equity returns. The realised SIP return also depends on the starting valuation, the path of inflation, the rupee, and the SIP discipline (continued through drawdowns, not abandoned). Historical Indian equity SIPs over 15- to 20-year horizons have produced attractive returns, but with significant intermediate volatility. The growth-return linkage is robust over very long periods; it is not a guarantee for any specific period.
What is the single best response to bad macro news in India?
For most salaried households, the disciplined default is to maintain the existing SIP, continue the planned investment cadence, and avoid making any structural change to the long-term allocation based on the news. Bad macro news has been a recurring feature of every multi-year period in any country’s history; the long-term equity SIP is structurally designed to outlast it. Specific tactical moves (a rebalance from equity to debt, a delay in a planned big purchase, a shift in the global allocation) should be driven by pre-committed triggers, not by the news cycle itself.
Related guides on this topic are coming to learnfinedge.com soon.