
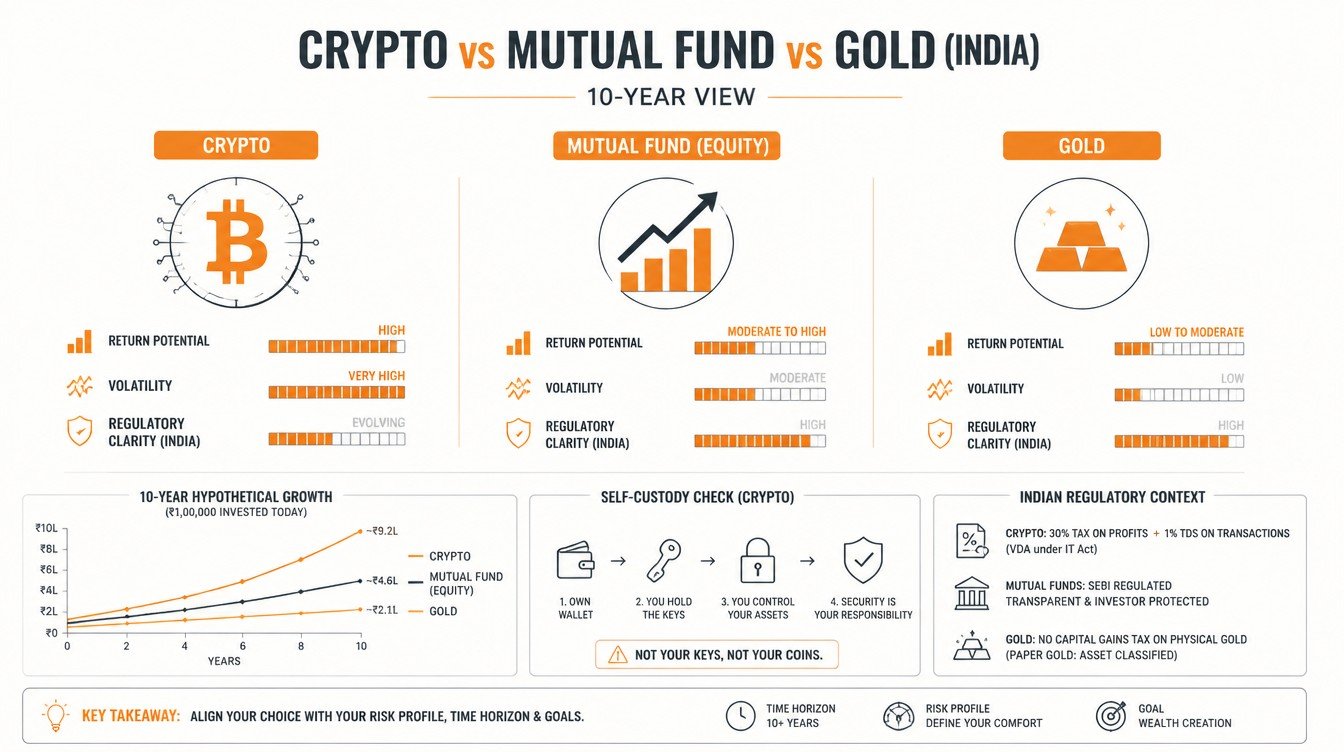
A clean crypto mutual fund gold comparison, run honestly over a full decade, does more to set realistic expectations than any forecast. Every Indian investor old enough to have lived through the 2017 demonetisation, the 2018-19 IL&FS shock, the 2020 pandemic crash, the 2021 crypto super-cycle, and the 2024 WazirX incident knows the same truth: looking at a single year of returns is meaningless. The honest question is what a decade of patience would have produced across the three asset classes that dominate retail conversations in India, run over the FY 2015-16 to FY 2025-26 window.
This guide walks through what the three categories produced over the past ten years on a CAGR basis, how their volatility and drawdowns compared, what an SIP-style monthly investor would have ended up with, and what the data implies for portfolio construction. It does not pick winners, recommend specific funds, or forecast future returns. Crypto carries leveraged volatility risk; do not invest more than you can afford to lose, and treat every backtest as a portrait of the past, not a promise of the future.

The Window Under Review and What It Captures
Backtests are honest only when the window is disclosed. The FY 2015-16 to FY 2025-26 window for this crypto vs mutual fund vs gold India comparison is wide enough to span multiple cycles in each asset class.
What the decade contained
The window includes the Indian equity bull run of 2014-2018, the small-and-mid-cap correction of 2018-2019, the COVID crash and recovery of 2020-2021, the global rate-hike cycle of 2022-2023, the post-rate-cycle equity rally of 2024-2025, two complete crypto super-cycles (2017 and 2021), the 2022 crypto winter, the 2024 WazirX incident, and the gold rally driven by central-bank buying and geopolitical risk in 2023-2025.
Why this window matters more than a five-year window
A five-year backtest would have given crypto’s last bull run too much weight, equity’s post-COVID recovery too much credit, and gold too little air. A ten-year window forces each asset class to show both its best and worst cycles, which is closer to what an actual long-horizon investor would experience.
The honest caveats
Returns over any window are sensitive to the start and end date. INR-denominated gold returns reflect the dollar-rupee depreciation as much as the USD gold move. Mutual fund returns vary widely by category (large-cap, mid-cap, multi-cap, debt). Crypto returns are dominated by a small number of large-cap coins; the basket return for the average Indian retail user, who churned and paid the 1% TDS plus 30% tax, has been materially lower than the headline Bitcoin number.
The Three Categories in Their Own Words
Before the numbers, a quick refresher on what each asset class is and how Indian investors typically access it.
Equity mutual funds
Equity mutual funds pool retail money and invest in a diversified basket of Indian (or international) stocks. The most common retail vehicle is the SIP, a monthly auto-debit that buys a fixed INR amount of units irrespective of price. Returns are taxed under Section 112A at 12.5% for long-term gains above Rs.1.25 lakh and at 20% for short-term gains, after the recent Budget 2024 rationalisation. Past performance is not indicative of future results, and mutual fund investments are subject to market risk.
Gold
Indian retail gold exposure comes through physical jewellery, gold bars and coins, Gold ETFs, Gold Mutual Funds, Sovereign Gold Bonds (SGBs), and digital-gold platforms. SGBs remain the most tax-efficient path for long-term holders (capital gains exempt at maturity), while Gold ETFs and Gold MFs offer liquidity without storage friction.
Crypto / VDA
The category includes Bitcoin, Ether, stablecoins, and the broader altcoin universe. Indian retail access is through FIU-IND registered exchanges. Every transfer is taxed at a flat 30% under Section 115BBH, with 1% TDS at the source under Section 194S, no loss set-off, no carry-forward, and no deduction beyond cost of acquisition. The asset class is meaningfully more volatile than equity and gold.

Crypto Mutual Fund Gold: CAGR and Maximum Drawdown
Specific point-in-time CAGR figures depend heavily on the exact start and end date, the basket composition, and currency assumptions. The qualitative pattern is more stable than the precise number.
What the decade produced (broad ranges, indicative only)
| Asset class | Indicative 10-year CAGR range (INR, gross of tax) | Indicative maximum drawdown | Typical 1-year volatility |
|---|---|---|---|
| Equity large-cap mutual fund (representative) | Low-double-digit, in the broad range of 11% to 14% | 30% to 40% (COVID 2020) | 15% to 20% |
| Equity mid- and small-cap mutual fund | Higher than large-cap, in the broad range of 13% to 18% | 50% to 60% (2018-2019, 2020) | 20% to 30% |
| Gold (INR terms, SGB or ETF) | High single-digit to low-double-digit, in the broad range of 9% to 13% | 15% to 20% | 10% to 15% |
| Bitcoin (USD-translated to INR) | Much higher than other classes over this specific window, but accompanied by far larger volatility | Greater than 70% (multiple cycles) | 60% to 80% |
| Broader crypto basket including altcoins | Wider variance than Bitcoin alone; many altcoins from 2017 and 2021 cycles have lost most of their value | Greater than 80% | 70% to 90% |
These ranges are indicative. The actual experience of any specific Indian investor depended on entry timing, fund selection, churn behaviour, and tax treatment. Investors should not anchor decisions on the upper bound of any range.
Reading the drawdowns honestly
The maximum drawdown column is the more useful data point than CAGR. An investor who allocated 80% to a mid-cap fund in early 2018 would have been deep in the red through 2019 and waited until 2021 to recover. An investor who put a meaningful sum into Bitcoin at the November 2021 peak waited two-plus years to break even. Gold’s drawdowns were the gentlest of the three, which is the entire reason for its presence in a diversified portfolio.
Risk-adjusted comparison
If CAGR is divided by volatility (a rough Sharpe-style ratio), gold and large-cap equity have historically delivered the cleanest risk-adjusted return for the typical Indian retail holder. Mid- and small-cap equity outperformed on returns but punished on drawdowns. Crypto’s headline CAGR was the highest in the window, but the risk-adjusted result was sharply lower because the volatility was so much larger, and the 30% tax plus 1% TDS plus no-set-off rule eats further into the after-tax outcome.
The 10-Year SIP Comparison
A monthly SIP of a fixed amount, sustained through ten years and through every drawdown, is a more honest test of retail experience than a lump-sum invested at the start.
How an SIP behaves across asset classes
In a volatile asset, a steady SIP picks up units cheaply during drawdowns and expensively during peaks, smoothing the entry price. The benefit is largest in assets with both high volatility and long-term uptrend. Equity mid-cap funds and crypto both fit the description; gold and large-cap equity benefit less because their volatility is smaller.
What a Rs.10,000 monthly SIP would have looked like (qualitative)
A Rs.10,000 monthly SIP from FY 2015-16 to FY 2025-26, sustained through every drawdown, would have produced a corpus very different across the four categories.
- A large-cap equity SIP would have produced a moderate corpus, with smoother behaviour and a steady upward path through the COVID dip.
- A mid- and small-cap equity SIP would have produced a larger corpus on paper, with longer underwater periods that test the investor’s patience.
- A gold SIP (through a Gold ETF or Gold MF) would have produced a respectable corpus, with the lowest drawdowns and a tighter range of outcomes.
- A Bitcoin SIP would have produced the widest range of possible outcomes, dominated by whether the final month was near a cycle peak or trough.
Specific corpus numbers depend on the chosen fund, the precise dates, and the tax treatment, which is why this guide describes the pattern qualitatively rather than publishing rupee-precise figures.
The behavioural reality
Most Indian retail SIPs do not actually survive ten years. The behavioural drop-off after a 30% drawdown is steep; after a 70% drawdown it is brutal. The asset that an investor actually holds through the bottom matters more than the asset that backtests best in spreadsheet form.

The Tax Drag: A Comparison That Matters
Backtests are usually run gross of tax. The Indian tax structure differs sharply across these three asset classes, and the after-tax CAGR is what matters to an actual investor.
Equity mutual funds
Long-term gains (units held more than 12 months) above Rs.1,25,000 in a year are taxed at 12.5% under Section 112A. Short-term gains are taxed at 20%. Loss set-off is allowed within the capital-gains head, and unabsorbed losses can be carried forward for eight years.
Gold
Physical gold, Gold ETFs, and Gold Mutual Funds are taxed under capital-gains rules with the holding-period definitions updated by recent Budgets. SGBs receive a capital-gains exemption at maturity for individuals, making them the most tax-efficient long-term gold vehicle for Indian retail. Interim coupon on SGBs is taxable at slab rates.
Crypto / VDA
Flat 30% on every profitable transfer under Section 115BBH, plus 4% cess and possibly surcharge, with no set-off of losses and no carry-forward. The 1% TDS at source adds working-capital drag throughout the year.
What this does to the comparison
A 25% CAGR before tax that suffers a 30% effective tax shrinks to roughly 17.5% after tax. A 12% CAGR before tax that suffers a 12.5% LTCG shrinks to roughly 10.5%. The pre-tax gap in favour of crypto shrinks substantially once the tax structure is applied. After accounting for the no-set-off rule, which forces taxation on every winner without relief from losers, the after-tax outcome for the average diversified crypto investor has often trailed the equity mutual fund corpus over this window.
What the Three Asset Classes Are Actually Good At
A useful way to read the backtest is to ask what each asset class contributes to a portfolio rather than which one “wins”.
Equity mutual funds: long-term compounding
Equity is the only major INR asset class that has compounded ahead of inflation reliably over multi-decade periods in India. The strength is patience-based: the longer the horizon, the higher the probability of a satisfactory outcome. The weakness is the path: the drawdown years are real and behaviourally hard.
Gold: drawdown insurance and currency hedge
Gold’s role in an Indian portfolio is not to maximise returns; it is to reduce drawdowns during equity stress and to hedge INR weakness during global risk-off events. The 2020 COVID period and the 2022-2023 global rate cycle both showed this character. A 10-15% gold allocation has historically improved the portfolio’s risk-adjusted return without materially reducing the long-run growth path.
Crypto: asymmetric optionality with real risk
Crypto’s strength is asymmetric upside in cycles; its weakness is severity of drawdowns and high tax friction. A small allocation (typically 1-5% of investable assets for those comfortable with the risk) can add return without dominating drawdowns, but only when the position is sized so that a 70% loss does not derail the financial plan. Larger allocations have historically delivered lower risk-adjusted outcomes for the average retail holder.
A Practical 10-Year Portfolio for Indian Retail
A backtest is only useful if it changes how money is allocated going forward. A reasonable framework for an Indian salaried investor with a 10-year horizon is built from layers rather than a single asset.
Layer 1: The emergency and short-term layer
Three to six months of expenses in a sweep-in fixed deposit or liquid mutual fund. This layer earns less but absorbs the unexpected, and its presence is what allows the equity-heavy layers below to ride out drawdowns without forced selling.
Layer 2: The core equity layer
50-70% of investable assets in a diversified equity mutual fund mix, typically a large-cap or multi-cap core with a smaller mid-cap allocation. Funded through a monthly SIP, with annual rebalancing.
Layer 3: The gold layer
10-15% of investable assets in gold, preferably via SGBs for the tax efficiency, supplemented by Gold ETFs or Gold MFs for liquidity. Periodic rebalancing between gold and equity helps capture the diversification benefit.
Layer 4: The crypto layer (optional)
1-5% of investable assets for those who are willing to tolerate 70%+ drawdowns and the 30% tax-plus-1%-TDS friction. Sized so that a worst-case outcome does not affect the rest of the financial plan. Held in a hybrid of regulated exchange (for INR convertibility) and a hardware wallet (for the long stack). Crypto carries leveraged volatility risk; do not invest more than you can afford to lose.
Common Backtest Mistakes Indian Retail Makes
Reading a 10-year comparison is an exercise in scepticism; a few familiar mistakes recur each time the topic appears in financial media.
Anchoring on cherry-picked windows
“Bitcoin returned X% in five years” usually starts the count at the 2018 trough and ends at the 2021 peak. A different five-year window would tell a different story. Always check the start and end dates.
Confusing nominal returns with real returns
A 10% nominal return in a 5% inflation environment is a 5% real return. Comparing nominal returns across asset classes without inflation-adjustment overstates the differential.
Ignoring path of returns
Two assets with the same CAGR can have very different drawdown experiences. The asset with the cleaner path is the one most investors actually hold through to the end. The asset with the wilder path tends to be sold during the trough.
Forgetting taxes and frictions
The post-tax, post-fee CAGR is the relevant number, not the headline. Crypto’s tax friction is the highest of the three categories; long-term equity through SGB-equivalent gold is among the lowest.
Extrapolating from a single decade
A ten-year backtest captures one or two macro cycles. The next ten years can rhyme rather than repeat. Backtests inform; they do not guarantee.
The Bottom Line for a 10-Year Indian Investor
The honest message of a crypto vs mutual fund vs gold India backtest over FY 2015-16 to FY 2025-26 is not “this asset wins”. The honest message is that diversification across the three works better than concentration in any one, and that the tax regime materially shrinks the after-tax case for the most volatile asset class.
What the data supports
A core equity allocation funded through a long-running SIP, a meaningful gold position (SGB-led) for drawdown protection, and a small, sized, and disciplined crypto sleeve for those who can bear the risk and complete the compliance work. The combination historically delivered a smoother ride than any single asset class over this window.
What the data does not support
The data does not support extrapolating Bitcoin’s headline CAGR into the next decade. It does not support replacing an equity SIP with a crypto position. It does not support skipping gold because returns were “boring”. And it does not support investing in any asset class without acknowledging the tax structure that will apply when the position is finally sold.
Frequently Asked Questions
Which asset class returned the most over the past 10 years in India?
On a gross-of-tax CAGR basis, Bitcoin’s INR-translated return has been higher than equity mutual funds and gold over the FY 2015-16 to FY 2025-26 window. After applying the 30% Section 115BBH tax, 1% Section 194S TDS, and no-set-off rule, the after-tax outcome for an average diversified retail crypto holder has frequently trailed a disciplined equity mutual fund SIP, and the maximum drawdowns have been multiples larger.
Should I do an SIP in Bitcoin or in a mutual fund?
Most retail investors should build the core SIP in an equity mutual fund and add a small (1-5%) sized crypto sleeve if and only if they can tolerate the volatility and the tax compliance burden. The equity SIP, sustained through drawdowns, has historically been the foundation of long-term wealth building for salaried Indian households.
Is gold still a good investment compared to crypto and equity?
Gold’s role is drawdown protection and currency hedging, not return maximisation. A 10-15% gold allocation, ideally through Sovereign Gold Bonds for tax efficiency, has historically improved the portfolio’s risk-adjusted return without materially reducing long-term growth. It complements equity and crypto rather than competing with them.
What is the maximum drawdown of crypto compared to equity in India?
Bitcoin has experienced drawdowns greater than 70% multiple times over the past decade; broader altcoin baskets have exceeded 80%. Large-cap equity mutual funds in India have typically experienced 30-40% drawdowns in stress periods, while mid- and small-cap funds have reached 50-60% in 2018-2019 and 2020. The volatility gap is the single most important number for sizing positions.
How do taxes change the crypto vs mutual fund comparison?
Equity mutual funds are taxed at 12.5% for long-term gains above Rs.1.25 lakh, with set-off and carry-forward allowed under Section 74. Crypto is taxed at a flat 30% under Section 115BBH with 1% TDS and no set-off. The after-tax gap between the two asset classes is significantly narrower than the pre-tax gap, and the tax regime is a major reason for sizing the crypto sleeve conservatively.
Related LearnFineEdge guides on Section 115BBH math, mutual fund SIPs, and Sovereign Gold Bonds are forthcoming and will be linked here as the cluster expands.