
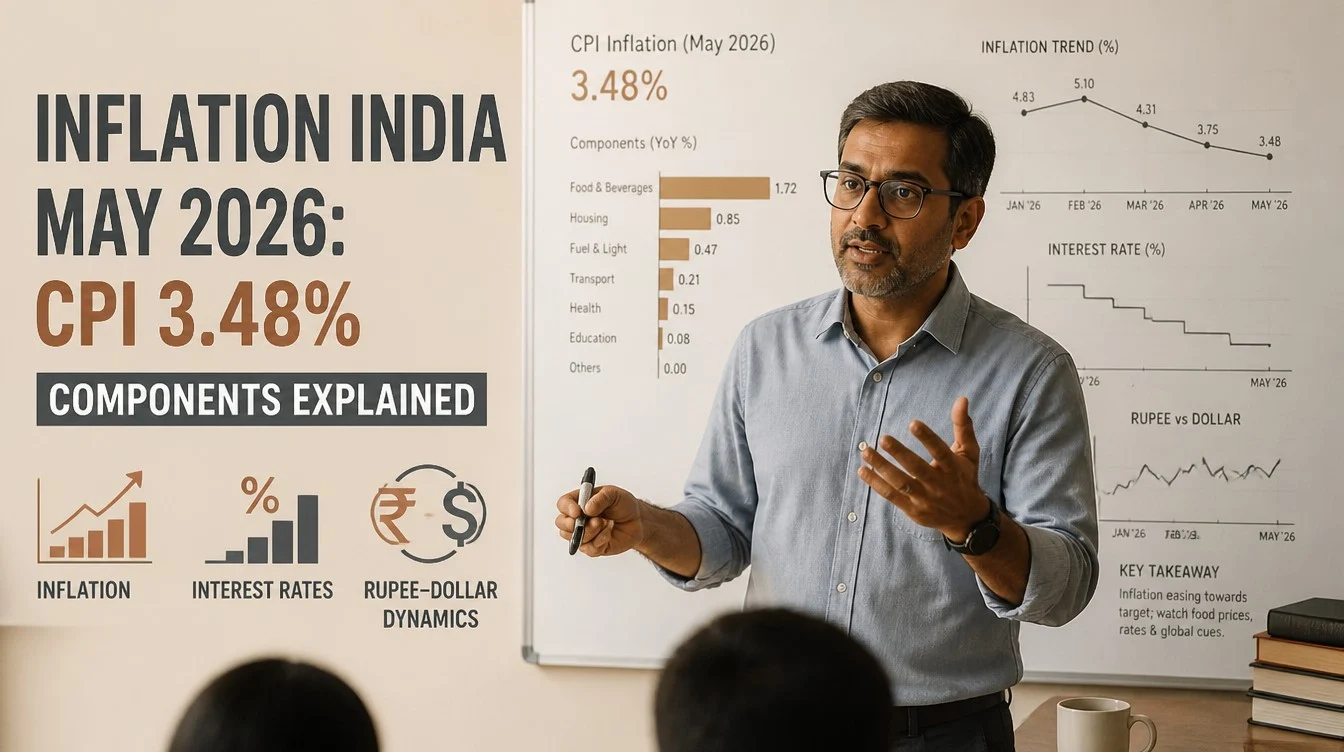
The inflation india 2026 picture opens with headline retail inflation for April at a provisional 3.48% year-on-year, food inflation rising to 4.20%, and core inflation steady around 3.7% for four straight months, according to the Ministry of Statistics and Programme Implementation (MoSPI). This read decodes those numbers component by component and translates them into what an average Indian household is actually absorbing in its monthly budget.
The picture is more mixed than the calm 3.48% headline suggests. Food inflation has accelerated, services prices are sticky, and certain housing and energy components are quietly nudging higher. A salaried reader who looks only at the headline number can miss the fact that the items they buy most often are inflating differently from those they buy rarely.
This guide walks through the CPI’s category structure, what each major basket contributed in the latest release, the difference between headline and core inflation, and how households can recalibrate their grocery, fuel, and utilities budgets to absorb the pressure without sacrificing financial goals.
What the April 2026 CPI Release Actually Showed
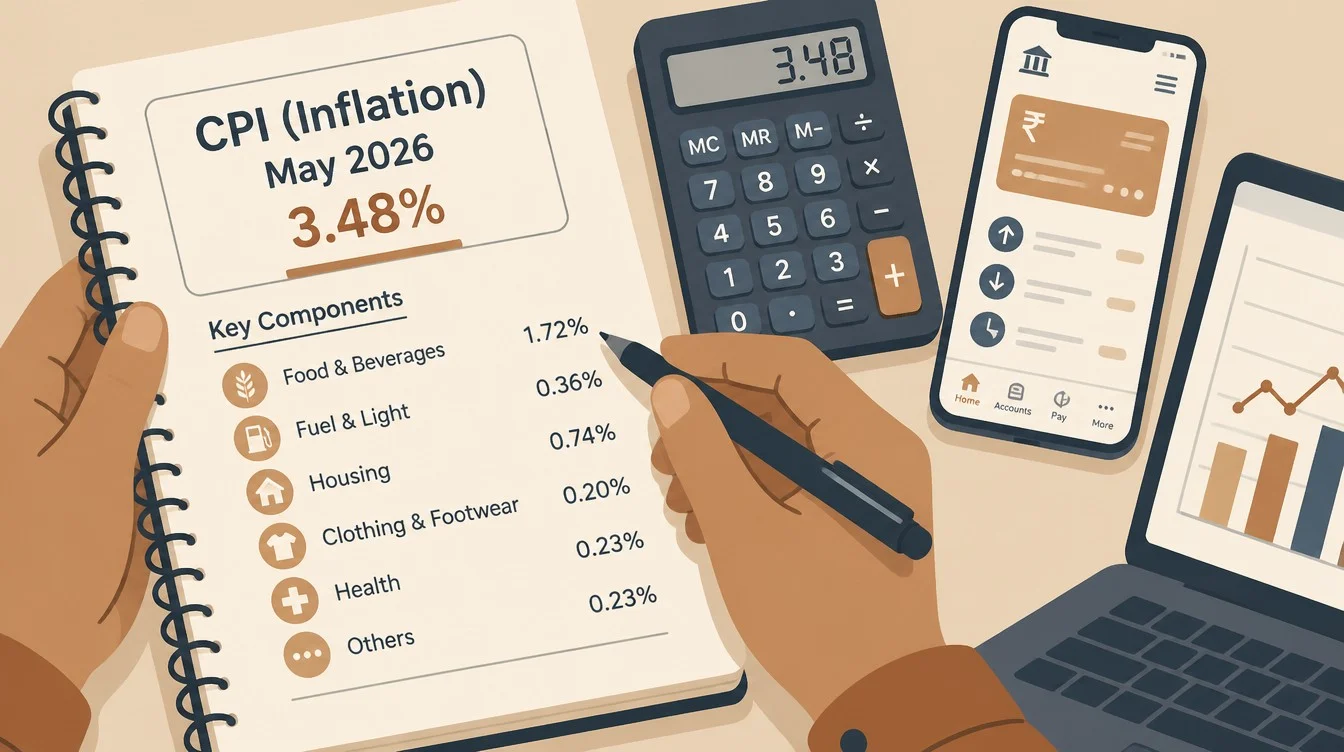
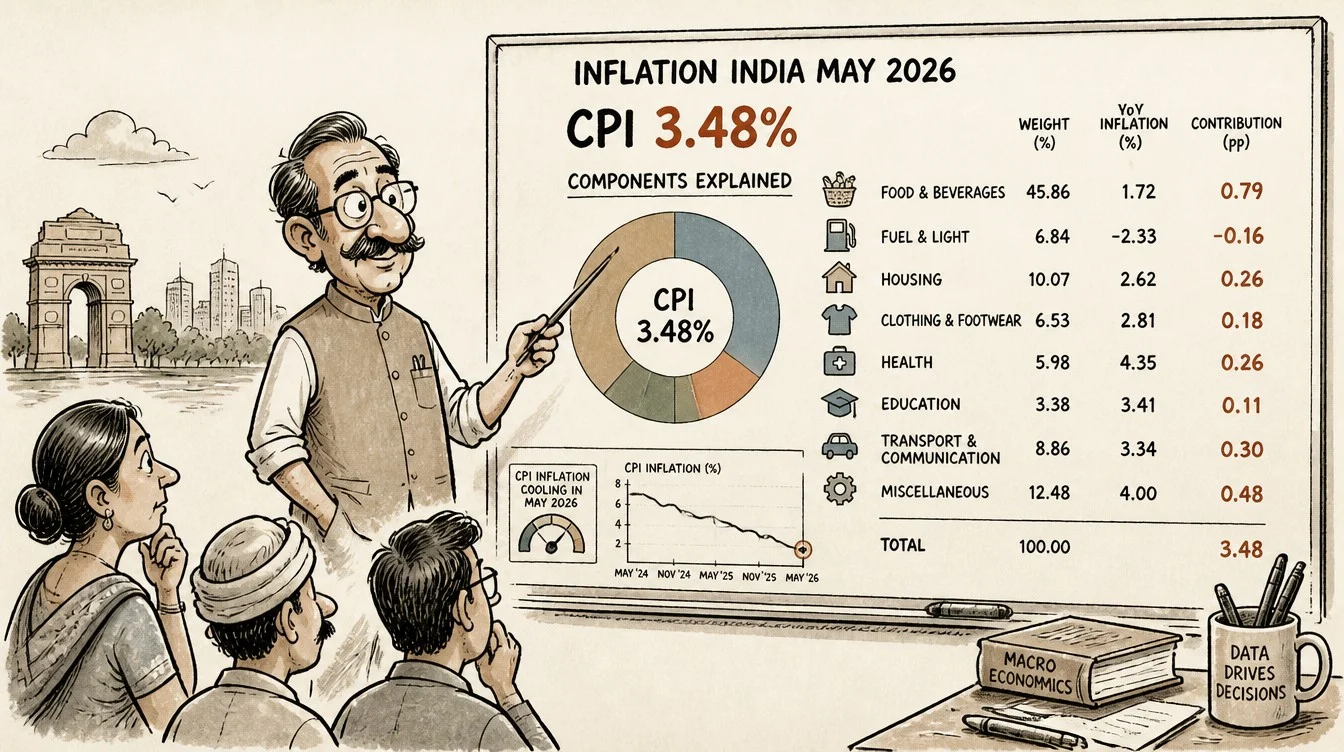
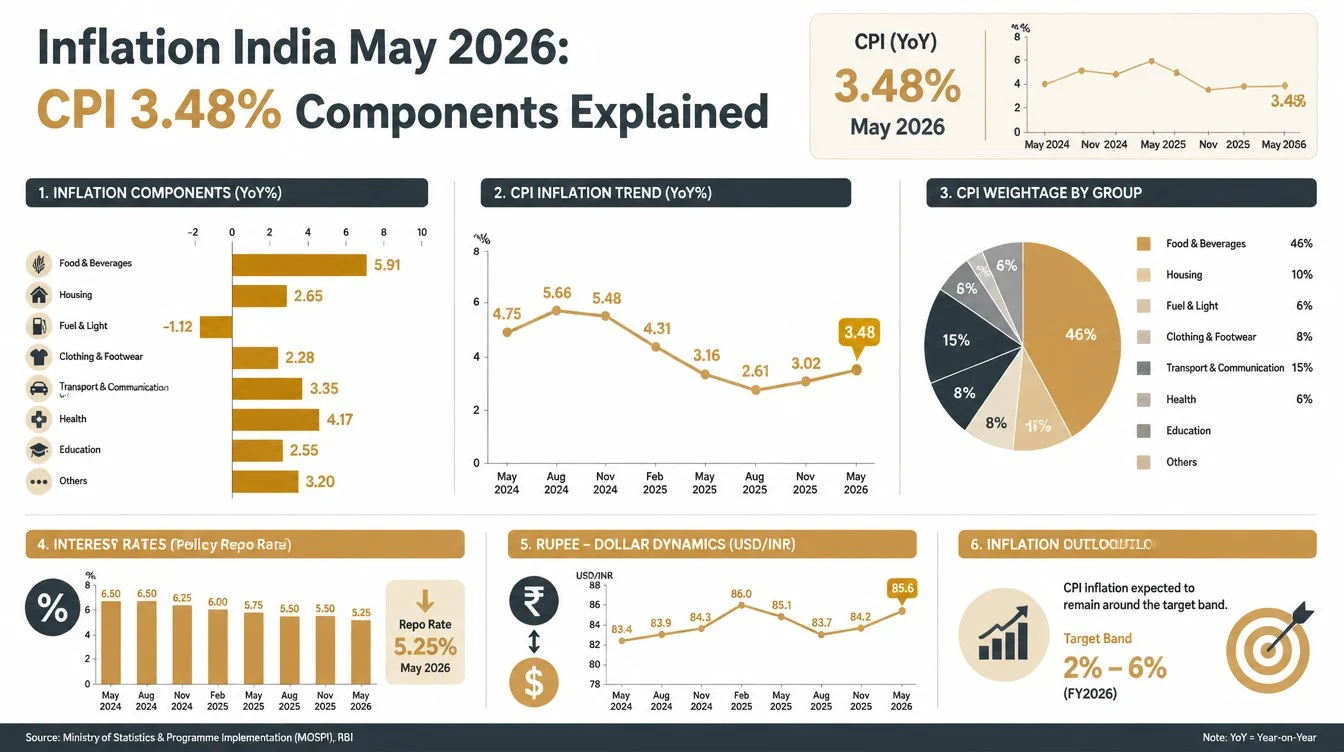
The MoSPI press release on May 12, 2026 reported the All-India CPI year-on-year inflation rate for April 2026 at 3.48% (provisional). The All-India Consumer Food Price Index (CFPI) was up 4.20%. Core inflation (CPI excluding food and fuel) was stable at around 3.7%, marking its fourth straight month at that level.
The headline was slightly hotter than March 2026 (3.40%) but well within the RBI’s tolerance band of 4% plus-or-minus 2%. Food inflation jumped meaningfully from March’s 3.87% to April’s 4.20%, signalling fresh food-side price pressure that the RBI MPC will be watching as it approaches its June 3-5 meeting.
Where the inflation is hiding
Two themes stand out. First, the food basket is the volatile cycle leader: vegetables, pulses, and edible oils have been swinging price-wise through 2026. Second, services inflation (housing rent, education, health) sits stickier than goods inflation, which is normal but matters for urban households.
Why core inflation matters separately
Core inflation strips out the noisy food and fuel components to reveal underlying price pressure. A stable 3.7% core tells the MPC that demand-side inflation is contained. If headline inflation rises further while core stays where it is, the source is supply-side food shocks, not overheating demand.
Inflation India 2026: How the CPI Basket Is Built
The CPI is a weighted index of the price changes of a representative basket of goods and services. Knowing the weights is critical because a 10% spike in vegetables hits households much harder than a 10% spike in education.
Approximate weights in the All-India CPI
| Category | Approximate Weight | What it contains |
|---|---|---|
| Food and beverages | ~46% | Cereals, vegetables, pulses, milk, egg, fish, meat, oils, fruits, spices, prepared meals |
| Pan, tobacco, intoxicants | ~2% | Tobacco and related items |
| Clothing and footwear | ~6% | Garments, footwear |
| Housing | ~10% | House rent (urban only; rural housing has zero weight) |
| Fuel and light | ~7% | LPG, electricity, kerosene |
| Miscellaneous | ~28% | Education, health, transport, communication, recreation, personal care, household goods |
Why food gets such a high weight
The CPI is intentionally weighted toward the consumption pattern of Indian households, and Indian households (especially in rural and lower-income segments) spend a large share of monthly income on food. So food inflation has an outsized effect on the headline number.
Urban vs rural CPI differences
The same headline CPI is calculated separately for urban and rural India. Rural CPI gives a higher weight to food. Urban CPI gives more weight to housing rent, transport, and education. The All-India CPI is a weighted blend of both.
Food Inflation: Where the 4.20% Lives
Food inflation at 4.20% for April 2026 is the warning light on this dashboard. Within food, the components do not move together.
Vegetables: the swing factor
Vegetable prices are the single most volatile component of the CPI food basket. Through 2026, vegetable prices have see-sawed with seasonal supply and weather conditions. Onion, tomato, and potato are the trinity that tends to drive India’s vegetable inflation headlines.
Pulses and edible oils
Pulses inflation has eased after a sharp spike in earlier years. Edible oils remain dependent on global prices (palm oil from Indonesia and Malaysia, soybean oil from the US and South America), making this component sensitive to global commodity moves and to import duty changes.
Cereals: relatively contained
Wheat and rice inflation has been relatively contained in 2026, helped by buffer stocks, open market sales by the government, and a benign monsoon expectation. Cereal prices nevertheless matter for lower-income households where staples take a larger share of food spending.
Milk, eggs, fish, meat
Protein inflation has been stickier than cereal inflation. Dairy prices in particular have crept up steadily, and meat and fish (especially in urban centres) reflect cold-chain logistics costs and seasonality.
Core Inflation: What “Sticky” Really Means
Core inflation at 3.7% has held steady for four straight months. That is the RBI’s preferred read on underlying price pressure because it filters out food and fuel volatility.
Inside the core basket
Core includes housing rent, education, health, transport (ex-fuel), communication, recreation, personal care, and household goods. Within this basket, services inflation tends to run a bit hotter than goods inflation. That is true across most economies, including India.
Why stickiness matters for the MPC
If core inflation refuses to fall below a certain floor (call it the underlying inertia), the MPC has less room to ease policy aggressively even when headline inflation drops. Stable core at 3.7% is mildly disinflationary versus the 4% midpoint of the inflation target but is not deeply below it.
What a salaried reader feels from core inflation
Rent renegotiations, school fee increases, doctor consultation fees, health insurance premiums, OTT subscriptions, and gym memberships all sit in core. If the household’s renewal calendar is heavy in this category, real living costs can outpace the headline CPI even when headline looks benign.
Fuel and Light: The Hidden Pressure
The fuel and light category covers LPG, kerosene, electricity, and other domestic fuel. In urban India, LPG and electricity dominate this basket.
LPG: subsidy-linked
The 14.2 kg LPG cylinder price for urban consumers (without subsidy) and the cooking gas subsidy for eligible households (PMUY beneficiaries) drive a large part of LPG inflation. Government policy decisions on subsidy quantum directly move this number.
Electricity: state-level tariff revisions
Electricity tariffs are set by state regulatory commissions and revised periodically. Tariff revisions in any given state lift that state’s electricity component of CPI. A national average masks state-level variation.
Transport fuel sits in miscellaneous, not fuel and light
A common confusion: petrol and diesel for personal vehicles sit in the transport sub-component of miscellaneous, not in fuel and light. Fuel and light is for in-home fuel.
Household Impact: What This Inflation Actually Costs
For a salaried family in metro India with a monthly household spend of around Rs.1,00,000 (1 lakh), the 3.48% headline inflation implies the same lifestyle costs about Rs.3,480 more per month than a year ago. The number under the hood, however, is more uneven.
A worked example for a metro family
Take a household spending Rs.1,00,000 per month at the following allocation: Rs.30,000 on food and groceries, Rs.20,000 on rent, Rs.10,000 on transport and fuel, Rs.5,000 on utilities, Rs.10,000 on education and child care, Rs.10,000 on health and insurance, Rs.15,000 on discretionary and other. Applying category-wise inflation gives:
- Food at 4.20% adds Rs.1,260 a month.
- Rent at around 3.5% adds Rs.700 a month.
- Transport and fuel collectively perhaps Rs.300 a month.
- Utilities perhaps Rs.150 a month.
- Education at around 4% adds Rs.400 a month.
- Health at around 5% adds Rs.500 a month.
- Discretionary at around 3% adds Rs.450 a month.
The household ends up paying roughly Rs.3,760 a month more, which is close to the implied headline drag. But because food, health, and education are pricier categories with sharper increases, the household feels the pinch in those line items most.
Why “lifestyle inflation” can exceed CPI
CPI measures a fixed basket. Real households upgrade lifestyle continuously: bigger flats, kids in more expensive schools, more aspirational travel. Lifestyle inflation can easily run 1-3 percentage points above CPI for upwardly mobile urban families.
How to Inflation-Proof a Household Budget in 2026
Households cannot stop inflation but they can protect specific budget lines.
Grocery and food spending
Bulk purchase of non-perishable staples (cereals, pulses, oils) when prices are favourable can lock in lower per-unit costs. For perishables, a more frequent local-market habit beats over-stocking. Many urban families have shifted some volume to subscription deliveries that price-lock periodically.
Rent renewals
Rent revision letters in India typically propose a 10% annual hike. Most renewals settle below that after polite negotiation, sometimes at 5% to 7%. Anchor the negotiation on CPI for urban housing in your locality, not on the landlord’s opening number.
Insurance premium renewals
Health insurance premiums have been rising at well above CPI in many tariff cycles. Comparing two or three insurers at renewal, considering top-up plans on a base of family floater, and matching coverage to actual usage all help.
Utilities
Electricity bills can be optimised via tariff slab awareness, peak-hour shifting, and rooftop solar where applicable. Water and gas have less slack but periodic review still helps.
Discretionary spending
Discretionary spending is where inflation hits with the least visible logic. A monthly subscription review (OTT, gym, magazines, app subscriptions) catches dead spends. Most households find Rs.500 to Rs.2,000 of dead subscriptions on the first audit.
Investment Implications of 3.48% Inflation
For investors, inflation defines the bar that real returns must clear.
Real return on bank FDs
A typical one-to-three year bank FD pays around 6.5% gross. After 20% tax slab, the post-tax return is around 5.2%. With CPI at 3.48%, the real post-tax return on this FD is roughly 1.7%. Modest but positive.
Real return on PPF
PPF currently pays 7.1% tax-free. With CPI at 3.48%, the real PPF return is roughly 3.5% (above CPI). For risk-averse investors, this is a meaningful real return that compounds tax-free over 15 years.
Real return on equity SIPs
Long-run Indian equity index returns have averaged in the low double digits over 15-20 year horizons. Net of LTCG tax and CPI, the real return has historically been positive by a wide margin, though with significant interim volatility. Past performance is not indicative of future returns.
Real return on debt funds
Short and medium duration debt funds offering yields in the 7% range generate post-tax real returns of around 1.5% to 2% after slab taxation, similar to FDs but with somewhat better tax efficiency for higher-bracket investors through indexation rules (where applicable).
Common Mistakes Households Make About Inflation
Confusing headline with personal inflation
The 3.48% headline reflects an average household basket. A household that eats out frequently, drives a lot, sends kids to elite schools, or lives in a high-rent area may experience personal inflation closer to 5%-6%. The personal experience is what should drive budget planning.
Ignoring core inflation
Core matters because services costs (housing, education, health) anchor long-term household budgets. A spike in tomato prices is annoying but temporary. A 7% increase in school fees compounds forever.
Chasing inflation-beating returns by taking too much risk
Some investors respond to inflation by shifting all savings to mid-cap or small-cap equity. That overshoots the actual gap. A balanced portfolio with realistic equity allocation usually beats CPI without the volatility shock.
Not adjusting goal corpus for inflation
A retirement corpus that looked adequate at today’s prices may fall short after 25 years of inflation. Inflation-adjusting goal targets (assuming 5%-6% long-term blended inflation) is the standard adjustment.
What the May and June Prints Will Tell the RBI
The MPC meets June 3-5, 2026. The CPI prints for April (released May 12) and May (to be released around June 12) are critical inputs.
The base effect through Q3 of FY27
The MPC’s April 2026 projection placed FY27 CPI at 4.0% in Q1, 4.4% in Q2, 5.2% in Q3, and 4.7% in Q4. The Q3 lift is largely base-effect driven (lower comparison base from the previous year). Whether actual prints overshoot the projected band is the live question for markets.
If food inflation sustains above 5%
A sustained food inflation print above 5% would shift the MPC toward a more cautious stance. It would make a June rate cut less likely.
If core eases below 3.5%
A sustained core print below 3.5% would open the door wider to further easing, since it would confirm that underlying demand pressure remains muted.
If headline stays in the 3% to 4% range
This is the path of least resistance for the MPC. Stable headline near target gives the committee room to act on either side as warranted by other factors (growth, rupee, global risk).
FAQs on Inflation India May 2026
What was India’s CPI inflation in April 2026?
The All-India Consumer Price Index (CPI) inflation for April 2026 was 3.48% year-on-year (provisional), according to the MoSPI release on May 12, 2026. Food inflation (CFPI) was 4.20%, and core inflation was steady around 3.7%. The headline was slightly higher than March’s 3.40%.
What is the difference between headline and core inflation?
Headline inflation is the full CPI year-on-year change, including all categories. Core inflation excludes food and fuel because those two categories are the most volatile. The RBI MPC monitors both; core is its preferred gauge of underlying demand-side price pressure.
How much does food inflation affect Indian households?
Food and beverages carry approximately 46% weight in the All-India CPI basket because Indian households (especially rural and lower-income) spend a large share of monthly income on food. A 4.20% food inflation print therefore moves the headline meaningfully and is felt directly in household grocery bills.
Will the RBI cut interest rates in June 2026 based on this inflation print?
The MPC meets June 3-5, 2026, and will consider multiple factors beyond just CPI: growth, the rupee, global oil prices, and Federal Reserve signals. A benign May 2026 CPI print could support a cut, but the MPC has emphasised data dependence. Forward-looking statements should be treated as possibilities, not certainties.
How can my household budget absorb inflation without cutting goals?
The standard approach is to inflate the income side (annual raise, freelance work, side income) at or above CPI while running a periodic budget review to catch dead subscriptions and renegotiate big-ticket renewals (rent, insurance). Inflation-adjusting goal corpus targets (assuming 5%-6% blended) protects long-term plans.
Related guides on the MPC reading framework, PPF returns vs inflation, and inflation-indexed bonds are forthcoming on LearnFineEdge.