The two inflation indices an Indian salaried investor hears about every month, CPI vs WPI India, are built on different baskets, computed by different ministries, and tell you very different things about the economy. The Consumer Price Index (CPI) is computed by the National Statistical Office (NSO) under MoSPI and is the index the Reserve Bank of India targets under its flexible inflation-targeting framework. The Wholesale Price Index (WPI) is computed by the Office of the Economic Adviser under the Department for Promotion of Industry and Internal Trade (DPIIT) and is used primarily as an industrial-pricing indicator. Understanding which one to read, and what each is telling you, is one of the more useful skills a salaried investor can develop. This article is educational and is not investment advice.
The decision matters because the RBI Monetary Policy Committee (MPC) explicitly targets CPI inflation at 4 percent with a tolerance band of plus or minus 2 percentage points, per the agreement notified by the Government of India under Section 45ZA of the RBI Act. The CPI print, not the WPI print, drives the policy rate decisions that flow through to your home-loan EMI, fixed-deposit rates, and bond-fund NAVs. The WPI tells you something different: how producer-level prices are moving, which is a useful leading indicator for some sectors but not the variable the central bank is reacting to.
What CPI measures and how its basket is built
The CPI (Combined) measures the change in retail prices paid by households across India for a fixed basket of goods and services. The basket and weights are drawn from the Consumer Expenditure Survey, and the current series uses the 2011-12 base year. Food and beverages carry the largest weight at roughly 45.86 percent (the food and beverages group), followed by miscellaneous services, fuel and light, clothing and footwear, housing, and pan, tobacco, and intoxicants in descending order.
The large food weight is the single most important feature of Indian CPI. It means that food-price shocks (vegetable prices, edible oils, cereals) move the headline CPI by a lot, sometimes by 100 to 200 basis points in a single month, even when the underlying pace of services and core-goods inflation is stable. This is also why the MPC pays close attention to core CPI inflation (CPI ex food and fuel), which strips out the most volatile components and reveals the underlying inflation trend.
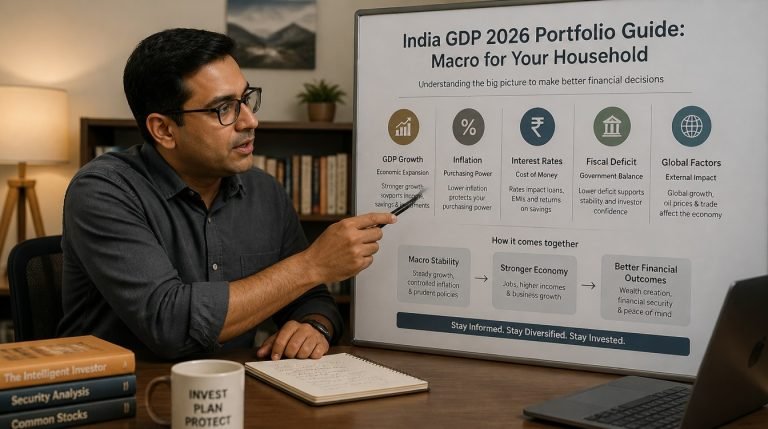
CPI data is released monthly by MoSPI, typically around the 12th of each month, for the preceding month. The release includes the headline All-India CPI, separate CPI for rural and urban areas, and group-level inflation rates that show what is driving the headline number. For context on how this feeds into the macro picture, see India GDP 2026 Portfolio Guide.
What WPI measures and how it differs from CPI
The WPI measures the change in wholesale-level prices, that is, the prices of goods sold in bulk between businesses before they reach the retail level. The current WPI series uses the 2011-12 base year and has three major groups: primary articles (around 22.6 percent weight), fuel and power (around 13.2 percent), and manufactured products (around 64.2 percent). WPI does not include services at all, which is one of the central reasons it is not used as the headline inflation target.
Because WPI is dominated by manufactured products and excludes services, it tends to track global commodity prices more closely than CPI does. A spike in crude oil prices, base metal prices, or other industrial commodities shows up first in WPI, often several months before it filters through to consumer prices. WPI can therefore signal incoming retail inflation in some segments, though the linkage is not mechanical.
WPI also captures different price points than CPI for the same broad commodity. Vegetable prices in CPI reflect retail mandi or supermarket prices; vegetable prices in WPI reflect mandi-level wholesale prices. The two can diverge sharply during seasonal cycles. WPI is released monthly by DPIIT, typically around the 14th of each month, two days after the CPI release.
Why the RBI targets CPI and not WPI
The RBI shifted to formal CPI-based inflation targeting in 2016 under the Monetary Policy Framework Agreement. Before that, the central bank used a multi-indicator approach that gave weight to both WPI and CPI. The shift to CPI was deliberate: the target should reflect the cost of living of the household whose welfare the policy is intended to protect, and CPI captures that directly, whereas WPI captures only the producer-level slice of the price chain.
The 4 percent CPI target with a 2 percentage point tolerance band on either side is the operational rule. CPI persistently above 6 percent or persistently below 2 percent is technically a breach of the target, and the RBI is required to explain the breach to the government and outline the corrective steps. The MPC’s policy-rate decisions are therefore tightly anchored to CPI trajectory, not WPI.
This is why CPI moves cause market reactions and WPI moves typically do not. A CPI print at 6.2 percent shifts expectations for the next MPC decision; a WPI print at minus 1 percent (deflation in wholesale prices) does not, on its own, change the MPC trajectory. For more on how the rate environment affects EMIs, see EBLR Home Loan Reset India.
The signal salaried investors should read from CPI
For a salaried investor, the most useful CPI signal is the direction relative to the 4 percent target. A headline CPI of 4.5 percent, with core CPI at 4.2 percent, signals that the MPC is likely to hold rates steady. A headline CPI sustained above 6 percent for two or three consecutive months signals that the MPC is likely to raise rates or hold them tighter for longer. A headline CPI sustained below 4 percent, with core CPI below 4 percent, signals room for the MPC to cut rates.
The rate trajectory then flows through to specific household decisions. A tightening cycle reduces equity valuations through the discount-rate channel, raises home-loan EMIs on EBLR-linked loans within the policy-reset window, and improves the yield on new fixed deposits and short-duration bond funds. A loosening cycle does the reverse. The CPI release is therefore a leading indicator for each of these decisions, even if the timing of any single rate move is hard to call.
The signal salaried investors should read from WPI
The WPI release is most useful as an early signal for sector-level pricing. A sharp rise in WPI manufactured-products inflation signals that producer costs are rising faster than retail prices have yet absorbed, which can compress margins in consumer-goods companies, packaged-food companies, and FMCG names until they pass through the higher costs to consumers. WPI primary-articles inflation tells you about the agricultural commodity environment, which affects rural-demand-sensitive sectors.
WPI fuel and power inflation is also a useful cross-check on global crude prices and domestic energy costs. A sharply higher WPI fuel print is rarely a surprise (it follows the international crude price chart) but the magnitude tells you how much of the global price has been absorbed by domestic excise and dealer-level adjustments. For most salaried investors, the WPI release is a quick scan rather than a deep read.
The three CPI sub-indices worth tracking
Within the CPI release, the three sub-indices that carry the most information for a salaried investor are food inflation, core inflation, and services inflation. Reading them together gives a much richer picture than the headline number alone.
- Food and beverages inflation: Drives the headline because of its 45.86 percent weight. Highly volatile due to monsoon, mandi pricing, and supply-chain shocks. The MPC discounts very high or very low readings as transitory unless they persist for several months.
- Core CPI (ex food and fuel): Reveals the underlying inflation pace. Below 4 percent gives the MPC room to ease; sustained above 5 percent makes easing very difficult regardless of headline.
- Services inflation: Sticky and demand-sensitive. Rising services inflation often signals that household income growth is fuelling broad-based price pressure rather than a one-off supply shock.
The Reserve Bank’s monetary policy reports and the MPC’s resolution statements explicitly comment on each of these sub-indices when explaining a rate decision. Reading the same data the MPC reads is the simplest way to anticipate the policy direction.
When CPI and WPI diverge sharply, what is happening
CPI and WPI sometimes move in opposite directions in the same month. The most common reason is the different commodity baskets: a sharp fall in global crude or metal prices drags WPI down (because manufactured products carry the largest weight) while CPI stays high because food and services prices, which dominate CPI, are unaffected. The 2014 to 2016 period saw exactly this pattern, with WPI in negative territory while CPI ran around 5 to 6 percent.
A reverse divergence (WPI high, CPI moderate) often reflects a commodity price shock that has not yet passed through to consumer prices. This is the scenario where margin pressure builds for manufacturers and packaged-goods companies in the interim. Both divergences eventually narrow as the pass-through completes, but the interim period can be material. The RBI bulletin and the MoSPI press release each month explain the underlying drivers of the headline numbers, and they are the cleanest source of context. See RBI website for the monetary policy reports.
Frequently Asked Questions About CPI vs WPI in India
Which inflation index does the RBI actually target?
The RBI targets CPI (Combined) inflation under the flexible inflation-targeting framework formalised in 2016. The target is 4 percent with a tolerance band of plus or minus 2 percentage points, set under Section 45ZA of the RBI Act. The MPC must explain to the government if headline CPI breaches the band (above 6 percent or below 2 percent) for three consecutive quarters. WPI is monitored as a supplementary indicator but is not the formal target.
Why does food inflation move CPI so much in India?
The food and beverages group carries roughly 45.86 percent weight in the CPI basket, reflecting the share of household spending on food in India. By contrast, food carries a much smaller weight in developed-economy CPIs (typically 10 to 20 percent). A 10 percent jump in vegetable prices therefore moves Indian headline CPI by far more than a similar move would shift CPI in the United States or the European Union. This is why core CPI (CPI ex food and fuel) is closely watched as the underlying trend indicator.
Does WPI affect my fixed deposit interest rate?
Indirectly, and only weakly. Fixed deposit rates are set by banks based on the repo rate (which is driven by CPI through the MPC), bank-level cost of funds, and competitive pressure. WPI does not directly influence FD rates because the MPC does not respond to WPI in its policy-rate decisions. A persistent WPI deflation alongside soft CPI could contribute indirectly to a lower-rate environment, but the actual driver of your FD rate is the CPI-driven repo rate trajectory.
Which release should I read first each month?
For most salaried investors, CPI is the primary read. It comes out first, typically around the 12th of each month, and directly affects the policy rate trajectory. WPI follows on the 14th and is a useful cross-check on commodity and producer-level pricing. If your portfolio has meaningful exposure to FMCG, packaged goods, or industrial sectors, WPI is worth a separate look. For pure equity-fund and FD investors, CPI is sufficient.
Why did India scrap the IIP-WPI deflator-based approach?
India formally moved to CPI-based inflation targeting in 2016 because CPI more directly captures the cost of living of households, which is the welfare measure the policy is intended to protect. WPI does not include services, which now form more than half of GDP, so it cannot serve as a comprehensive inflation gauge. The 2014 Patel Committee report recommended the shift to CPI, and the Monetary Policy Framework Agreement implemented it the following year. WPI continues to be published as an industrial-pricing indicator.
How can a salaried investor use core CPI in decisions?
Core CPI (CPI ex food and fuel) is the cleanest signal of underlying inflation pressure. When core CPI runs around 4 percent or lower, the MPC has room to cut or hold rates; when it rises above 5 percent, the MPC is constrained. For a salaried investor, a core CPI trending higher signals tightening EMI environments and weaker equity valuations on the discount-rate channel. A core CPI trending lower signals the opposite. The monthly CPI release breaks out the core figure alongside the headline.