

Every salaried earner in India eventually hits the same wall. The monthly credit lands in the bank, a few EMIs auto-debit on the second of the month, the grocery and Swiggy bills quietly drain the rest, and by the 25th the savings plan is whatever happens to be left over. The 50-30-20 rule india framework flips that sequence. Instead of saving what remains, it splits the take-home pay into three buckets at the start of the month, so the savings are claimed first and the rest of the budget has to fit inside the remaining envelope.
This guide rebuilds the popular 50-30-20 budget for the Indian salaried context for FY 2025-26, with worked examples at three common take-home levels, an honest adjustment for high-rent metros like Mumbai and Bengaluru, a clear line between needs and wants in the Indian household, and a comparison with two alternative rules that may fit better at certain life stages. It is a planning template, not financial advice; the goal is to give a defensible starting point that can be tightened over a few months of real expense tracking.

What the 50-30-20 Rule Means for an Indian Salaried Earner
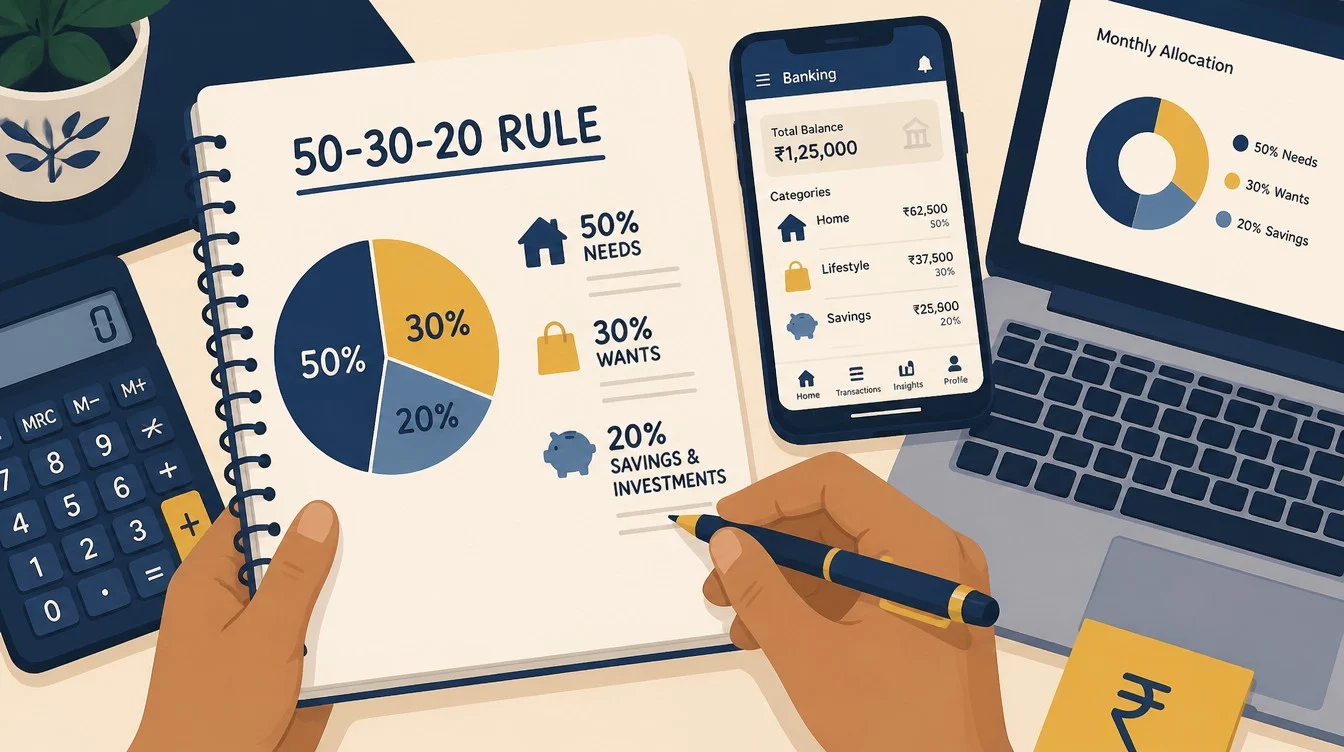
The 50-30-20 rule is a simple cash-flow split. It allocates 50 percent of monthly take-home pay to needs, 30 percent to wants, and 20 percent to savings and debt repayment. The version most personal-finance writers in India use is anchored to in-hand salary after Provident Fund, professional tax, and income tax, not gross CTC.
The rule traces back to U.S. policy writing in the early 2010s, but it has travelled to Indian household budgeting because it is easy to remember and easy to verify against a single salary slip. The point is not the precise ratios; the point is to claim the savings bucket before the discretionary bucket starts spending.
Why the rule is built on take-home, not CTC
Cost-to-company in India typically inflates the pay number with employer-side EPF, gratuity provisioning, group insurance, and variable components. None of these arrive in the bank account each month. Budgeting against CTC overstates spending capacity by 15 to 30 percent depending on the company structure. The defensible base is the net credit on the salary slip, which already reflects EPF, professional tax, tax deducted at source, and any voluntary deductions.
The three buckets in plain language
The needs bucket covers what a household must pay to live and stay employed: rent, groceries, utilities, transport to work, school fees, health and term insurance premiums, and minimum EMI obligations. The wants bucket covers everything that improves life but is optional in a given month: dining out, OTT subscriptions, holidays, premium gadgets, and brand upgrades. The savings and investment bucket covers emergency fund top-ups, SIPs into mutual funds, voluntary EPF or PPF contributions, NPS additions, and any accelerated repayment on high-interest debt above the contracted minimum.
Why this rule appeals in India specifically
Indian salaried earners face two structural pressures: high implicit savings expectations from family, and an inflation rate that has hovered between roughly 4 and 7 percent in recent years per RBI bulletins. The 50-30-20 split builds in a 20 percent savings floor, which compounds meaningfully over a 25 to 30 year working life. A common rule of thumb in Indian personal finance is that anyone saving less than 15 percent of take-home will struggle to retire comfortably even at modest lifestyle levels.
How to Calculate Your Take-Home Pay Before Allocating
The allocation only works if the base number is honest. The take-home figure to use is the actual credit that lands in the salary account, averaged over three months if the income includes a variable component.
Reading the salary slip end-to-end
A standard Indian salary slip lists gross salary at the top, then deductions for employee Provident Fund at 12 percent of basic, professional tax (capped at Rs.200 per month in most states), TDS based on the chosen tax regime, and any voluntary deductions like NPS Tier I or company-mandated insurance. The figure at the bottom, often labelled “Net Pay” or “In-hand Salary”, is the budgeting base.
Handling variable pay and annual bonuses
Variable pay should not enter the monthly budget. The conservative approach is to treat the fixed monthly credit as the budget base and route any quarterly variable or annual bonus directly into the savings bucket, or split it across savings and a one-off lump sum want like a holiday. This keeps the lifestyle anchored to the predictable number.
Quick check against the bank statement
The simplest verification is to open the salary account and check the credit amount for the last three months. If those three numbers are within 2 to 3 percent of each other, that average is the take-home base. If they vary by more than 10 percent, the lowest of the three is the safer planning number.
Worked Example 1: Rs.50,000 Monthly Take-Home
The first worked example takes a young professional in a tier-2 city or in a tier-1 city with a shared flat. Monthly take-home is Rs.50,000. Under the textbook split, that becomes Rs.25,000 for needs, Rs.15,000 for wants, and Rs.10,000 for savings.
Where the needs bucket actually goes
In a non-metro setting the Rs.25,000 needs envelope is workable. A typical allocation might be Rs.9,000 for rent in a shared 2BHK, Rs.5,000 for groceries and home essentials, Rs.2,000 for electricity, gas, and water, Rs.2,000 for mobile and broadband, Rs.3,000 for commute and fuel, Rs.2,500 for a basic term plan and health top-up, and Rs.1,500 for unavoidable household items. The envelope closes with a small buffer.
Where the wants bucket goes
Rs.15,000 of wants is generous at this income level and creates the biggest risk of lifestyle inflation. Dining out twice a week, OTT subscriptions, weekend recreation, occasional shopping, and a small monthly travel fund all fit inside this envelope. The discipline is to stop spending when the envelope is empty, not to dip into the savings bucket.
Where the savings bucket goes
Rs.10,000 monthly translates to Rs.1,20,000 per year before any returns. The standard ordering for a first-time investor is: top up an emergency fund of three to six months of needs first, then begin a mutual fund SIP through an AMFI-registered distributor or direct platform, then layer in PPF or voluntary EPF for the tax-advantaged debt allocation. Equity SIPs into broad-market index funds remain market-linked and carry market risk; the standard caveat that past performance is not indicative of future results applies.
Worked Example 2: Rs.1,00,000 Monthly Take-Home
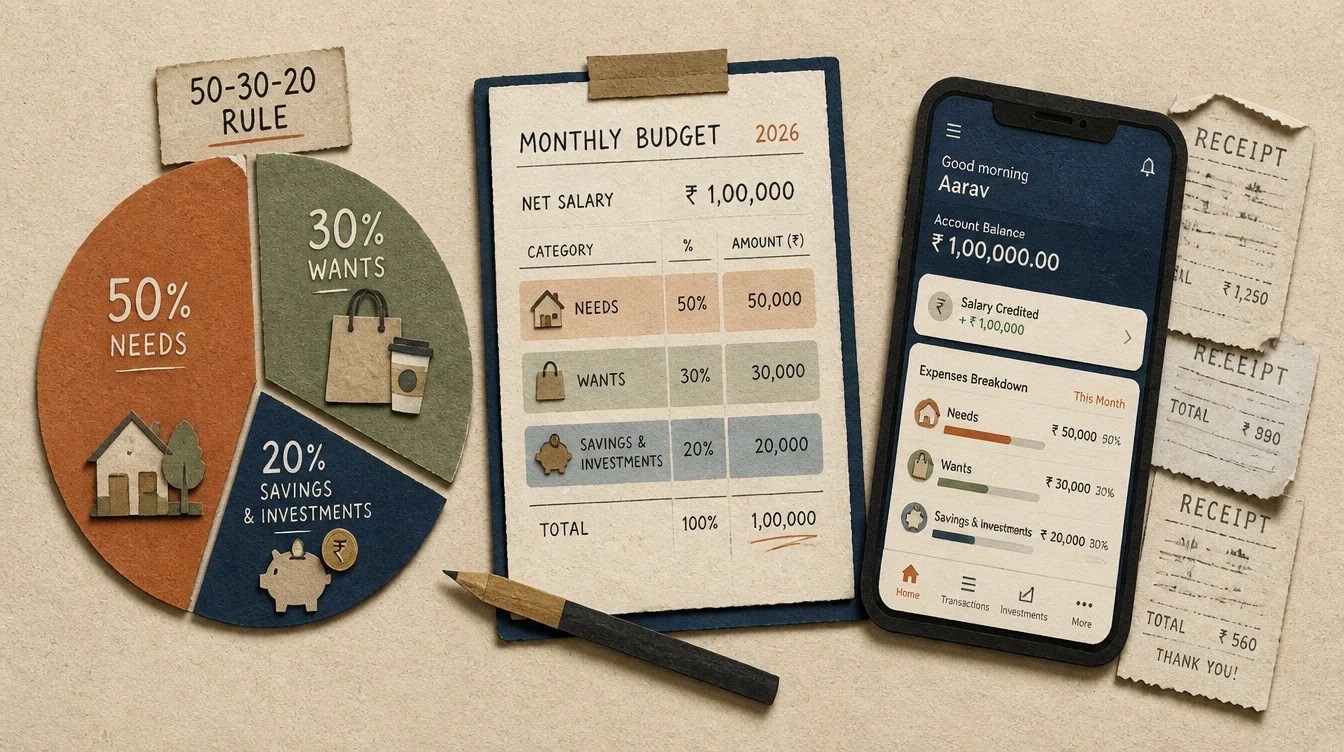
The next example doubles the income to Rs.1,00,000 take-home, the band where many mid-career salaried earners sit. The textbook split is Rs.50,000 for needs, Rs.30,000 for wants, and Rs.20,000 for savings. This is where the rule starts to flex against real metro costs.
Needs bucket: where the rule starts to strain
In a tier-2 city the Rs.50,000 needs envelope comfortably absorbs a one-bedroom rental, full grocery and utility costs, family transport, school or coaching fees for one child, term and health insurance premiums, and EMI minimums. In a tier-1 metro, especially Mumbai or Bengaluru, the rent alone for a small one-bedroom flat in a central location can absorb Rs.30,000 to Rs.40,000, which leaves very little for the other essentials. The high-rent adjustment in a later section addresses this.
Wants bucket and the lifestyle-inflation trap
Rs.30,000 a month for discretionary spending can finance two short domestic trips a year, regular dining out, a premium phone refresh every two to three years, and a healthy entertainment budget. The biggest psychological trap at this income level is letting wants quietly migrate into the needs bucket. A car EMI on a premium SUV, for instance, is a want dressed up as a need. The cleanest defence is to write the asset off as discretionary at purchase and force it back into the 30 percent envelope.
Savings bucket and the first real tax conversation
Rs.20,000 a month is Rs.2,40,000 a year. At this income, the choice between the new and old tax regimes starts to matter materially. The new tax regime is the default under Section 115BAC for FY 2025-26 and offers a higher standard deduction and revised slabs but withdraws most of the older deductions. The old regime keeps Section 80C, 80D, HRA, and home loan interest deductions but with the older slab structure. The right answer depends on actual deductible spending; running both calculations on a salary calculator from the Income Tax Department portal each February is the standard discipline.
Worked Example 3: Rs.2,00,000 Monthly Take-Home
The third example moves to Rs.2,00,000 take-home, a band that covers senior individual contributors and middle managers in tech, finance, and consulting. The textbook split is Rs.1,00,000 for needs, Rs.60,000 for wants, and Rs.40,000 for savings.
The needs bucket usually has slack at this level
Even in Mumbai or Bengaluru, a Rs.1,00,000 needs bucket can cover a comfortable two-bedroom rental, full household groceries, two-child school fees at a mid-tier private school, family health and term insurance, and a single car EMI. The realistic spend is often closer to Rs.70,000 to Rs.85,000, which creates an interesting question.
The “needs slack” question: redirect to savings or to wants
The honest answer is to push the slack into savings rather than letting it slide into wants. If actual needs come in at Rs.80,000, the Rs.20,000 of unused envelope is a free pre-tax increase to the savings rate. At this income, the savings rate can credibly run at 30 percent or higher of take-home without lifestyle damage, which materially shortens the path to financial independence.
Wants bucket at this band
Rs.60,000 a month of discretionary spending finances overseas travel every other year, premium subscriptions, occasional luxury, and a meaningful gifting and household-upgrade budget. The rule does not require all of it to be spent. The 30 percent figure is a ceiling, not a target.
Savings bucket and asset allocation
Rs.40,000 a month is Rs.4,80,000 a year. At this savings rate, the allocation question becomes interesting. A salaried earner already has implicit fixed-income exposure through EPF, which compounds at the rate notified by EPFO each year. Layering equity mutual fund SIPs into broad-market index and large-cap funds, a smaller satellite allocation to mid-cap or international funds, and a separate goal-based debt allocation through PPF, government bonds, or short-duration debt funds builds a balanced portfolio. SEBI-registered investment advisers can help size the equity-debt mix; AMFI distributor research is a starting point but is not personalised advice.
The High-Rent Metro Adjustment for Mumbai and Bengaluru
The honest weakness of the textbook rule is that it breaks for renters in high-cost metros. Rent in central Mumbai, central Bengaluru, Gurugram, parts of Pune, and Hyderabad can easily consume 30 to 40 percent of take-home all by itself, which makes a 50 percent needs envelope mathematically tight before any other essentials.
What the budget split actually looks like in a Mumbai 1BHK
Consider a Rs.1,00,000 take-home earner renting a one-bedroom flat in a Mumbai suburb like Andheri East or Powai. Rent and brokerage-amortised cost can land at Rs.35,000 to Rs.45,000. Add Rs.7,000 of groceries, Rs.3,000 of utilities, Rs.4,000 of mobile and broadband, Rs.5,000 of commute, and Rs.4,000 of insurance premiums, and needs already cross Rs.58,000. That is 58 percent of take-home, not 50.
The metro-adjusted 60-25-15 fallback
A workable adjustment for high-rent metros is a temporary 60-25-15 split. Needs absorb 60 percent, wants drop to 25 percent, and savings hold at 15 percent. The savings rate stays above the commonly cited 15 percent personal-finance floor, and the discretionary bucket takes the hit rather than the savings bucket. The split is meant to be temporary, revisited each year as income grows or rent moderates.
The HRA tax angle
Salaried earners in metros who claim House Rent Allowance under the old tax regime get a meaningful tax shield. The HRA exemption is the least of: actual HRA received, rent paid in excess of 10 percent of basic salary, and 50 percent of basic for metros (40 percent for non-metros) under the Income-tax Act, 1961. The full computation belongs on the Income Tax Department portal during return filing; the budgeting takeaway is that part of the metro rent is effectively tax-subsidised under the old regime, which slightly improves the real needs-to-take-home ratio.
What Counts as Needs vs Wants in the Indian Context
The cleanest line between needs and wants is the question: if income dropped 20 percent next month, would this expense survive the cut. Anything that survives is a need; everything else is a want. The Indian household has a few category-specific edge cases worth spelling out.
Rent and home loan EMIs
Rent is unambiguously a need. A home loan EMI is also a need because non-payment carries severe consequences with the lender and credit bureau. The portion of EMI that represents principal repayment is technically forced savings, but for cash-flow purposes the full EMI sits in the needs bucket.
Insurance premiums
Term life insurance and a comprehensive family health insurance policy are needs for any earner with dependents. Endowment, ULIP, and investment-linked insurance products are not strictly needs; they sit between savings and wants depending on the buyer’s intent. IRDAI guidance is that pure protection should come before investment-linked products, which is a useful default.
School fees, coaching, and education
School fees for children already enrolled are a need. Discretionary upgrades to a more expensive school or non-essential coaching are wants unless the household has explicitly committed to that expense as a long-term priority.
Vehicle EMIs and fuel
A two-wheeler or modest car used for daily commute is closer to a need; a second car, a premium upgrade, or a fuel bill driven by leisure use sits in the wants bucket. The honest test is whether the commute would be impossible without the vehicle.
Subscriptions and family expectations
OTT subscriptions, gym memberships not tied to a medical recommendation, music apps, and cloud storage upgrades are wants. Recurring gifts and remittances to extended family vary by household norm; the cleanest accounting is to budget a fixed monthly amount inside the wants bucket and let it run.

How Does the 50-30-20 Rule Compare to 70-20-10 and 60-30-10?
The 50-30-20 split is not the only popular rule. Two alternatives show up in Indian personal-finance writing: 70-20-10 and 60-30-10. The choice depends on income band, life stage, and debt load.
Featured-snippet answer
The 50-30-20 rule allocates 50 percent of take-home to needs, 30 percent to wants, and 20 percent to savings, suiting mid-income salaried earners. The 70-20-10 rule directs 70 percent to expenses, 20 percent to savings, and 10 percent to debt repayment or giving, suiting lower-income or heavily indebted earners. The 60-30-10 rule allocates 60 percent to needs, 30 percent to savings, and 10 percent to wants, suiting high earners pursuing aggressive financial independence.
A side-by-side comparison table
| Rule | Needs / Essentials | Wants / Discretionary | Savings & Debt | Best suited for |
|---|---|---|---|---|
| 50-30-20 | 50% | 30% | 20% | Mid-income salaried earners in tier-1 and tier-2 cities |
| 60-25-15 (metro adjusted) | 60% | 25% | 15% | Renters in high-cost metros where rent alone is 30%+ of take-home |
| 70-20-10 | 70% | 10% | 20% (split: 10% savings, 10% debt) | Early-career earners or households servicing high-interest debt |
| 60-30-10 | 60% | 10% | 30% | High earners pursuing financial independence early |
When 70-20-10 fits better
An earner with a credit-card balance carrying interest above 30 percent annualised, or a personal loan above 15 percent, should arguably prioritise debt repayment over building a wants budget. The 70-20-10 split frees a dedicated 10 percent envelope for accelerated debt repayment over and above the contracted EMI minimum, which compresses the payoff timeline materially.
When 60-30-10 fits better
An earner at Rs.2,00,000+ take-home with controlled lifestyle, or a dual-income couple with shared expenses, can credibly run a 60-30-10 split where savings absorb 30 percent. This is the FIRE-adjacent variant, where the aim is to retire on portfolio income in 15 to 20 years rather than the usual 30 to 35.
Step-by-Step Implementation for the First Three Months
The rule is easy to describe and hard to install. The reason most attempts fail is that the spending data is unreliable in month one. A staged three-month rollout is far more durable than trying to hit perfect ratios from day one.
Month 1: track without changing anything
The first month is data collection only. Track every expense in a simple spreadsheet or any UPI-linked expense tracker. Do not change behaviour. At the end of the month, total the spend in each of the three buckets and compute the actual ratio. Most households are surprised at the gap between belief and reality.
Month 2: shrink one bucket by 10 percent
In month two, identify the single largest line in the wants bucket and cut it by 10 percent. Identify the single largest line in the needs bucket that has any discretion (often groceries or commute) and trim it by a similar share. Route the freed-up amount into the savings bucket on the same day the salary credits, before any other transaction. Automate this with a standing instruction if possible.
Month 3: lock the savings transfer first
In month three, set up an automated transfer of the target savings amount, say Rs.10,000 or Rs.20,000, on the 2nd or 3rd of each month into a separate savings account or directly into SIP mandates. The rest of the month then operates on whatever is left. This sequencing is the single most powerful change.
The numbered starter checklist
- Calculate honest take-home from the last three months of bank credits.
- List every recurring expense and tag it as need, want, or savings.
- Choose the rule variant that matches the income and city (50-30-20, 60-25-15, 70-20-10, or 60-30-10).
- Set up an automated savings transfer for the target percentage on payday + 1.
- Re-tag any expense that is genuinely ambiguous, defaulting to wants if in doubt.
- Review the actual ratios at month-end and tighten one line each month.
Common Mistakes Salaried Earners Make With This Rule
The rule looks foolproof on paper. In practice, a handful of recurring mistakes hollow out the savings rate even when the ratios appear intact on a spreadsheet.
Treating CTC as the base instead of take-home
Budgeting against CTC consistently overstates spending power and produces a savings rate that is 5 to 10 percentage points lower than the headline number. Every reset of the budget should start with a fresh look at the actual bank credit, not the offer letter.
Mislabelling wants as needs
The most common slip is letting a premium category creep into the needs bucket. A specific car model, a particular school, a particular phone, a particular brand of groceries, are all upgrades that should sit in the wants bucket. The clean test is the 20 percent income drop scenario described earlier.
Ignoring annual and lumpy expenses
Insurance premiums paid annually, vehicle insurance renewals, school admission fees in March, festival spending in October and November, and travel during long holidays are real expenses that monthly budgets often ignore. The defensible fix is to divide each annual expense by twelve and accrue it monthly into a sinking fund inside the relevant bucket.
Saving “what is left”
The single most damaging mistake is keeping savings as a residual at the end of the month. By the 25th, the residual is rarely the planned amount. Reversing the order, where savings transfer first and the rest of the budget operates on the residual, is the structural fix.
Confusing investment with insurance
ULIPs, traditional endowment plans, and money-back policies sit in a fuzzy zone between savings and insurance. IRDAI documentation and standard personal-finance guidance both point to keeping the two functions separate: a pure term plan in the needs bucket, mutual funds and PPF in the savings bucket. Combining the two through an investment-linked insurance product usually delivers inferior outcomes on both fronts.
Adjusting the Rule Through Life Stages
The 50-30-20 split is a steady-state framework. The realistic application varies by life stage, because needs and savings priorities change materially across a 30-year working life.
Early career, ages 22 to 28
Rent is typically shared, dependents are usually nil, and savings have the longest compounding window. A defensible split for this stage pushes the savings rate to 25 or 30 percent at the expense of wants, not needs. Equity SIPs into broad index funds carry market risk but historically offer the strongest long-term real returns; the longer compounding window in this stage justifies a higher equity allocation in the savings bucket.
Family formation, ages 28 to 40
Needs expand because of school fees, larger housing, and family insurance. The textbook 50-30-20 rule fits this band most naturally. Term insurance equal to 10 to 15 times annual income, family health cover with super top-up, and disciplined SIPs into a goal-based corpus for the children’s education are the standard moves.
Mid-career, ages 40 to 50
Income is usually highest and the home loan is partially repaid. The wants bucket can shrink while savings rise. A 50-25-25 or 55-20-25 variant works well, with the savings bucket increasingly tilted toward debt and balanced funds as the retirement horizon shortens.
Pre-retirement, ages 50 to 60
The savings bucket reweights toward capital preservation. Senior Citizens Savings Scheme, Pradhan Mantri Vaya Vandana Yojana, government bonds, and short-duration debt funds become more prominent. Equity exposure remains, but the SEBI-recognised principle that asset allocation should match the time horizon means a reduction in pure equity exposure as retirement approaches.
Where the 50-30-20 Rule Falls Short and What to Do About It
No single ratio fits every household. The 50-30-20 rule deserves a careful list of caveats, not only because it can break for metro renters but also because it sometimes underestimates the savings rate that a household can actually sustain.
It can be too lenient for high earners
For earners at Rs.2,00,000 take-home or above, a 20 percent savings rate may be the floor, not the ceiling. The rule should be treated as a minimum standard for this group, with the savings rate pushed up wherever lifestyle permits. A blunt question is useful: would a 30 percent savings rate actually require a visible lifestyle cut.
It assumes the household has no high-interest debt
The standard rule treats the debt question as fully absorbed inside the savings bucket. For households with credit-card balances, BNPL revolving balances, or unsecured personal loans, debt repayment should arguably come before any new savings beyond the emergency fund. RBI data shows credit-card interest in India typically runs in a band of roughly 30 to 42 percent annualised, which is materially above the long-term return on any equity portfolio.
It is not goal-aware
The split says nothing about whether the 20 percent savings is going into a retirement corpus, a child’s education fund, or a house down payment. A real implementation has to overlay goal buckets on top of the 20 percent allocation. Goal-based investing through SEBI-registered advisers or AMFI-registered distributors usually starts with a list of explicit goals, target amounts, and time horizons.
The fix: use the rule as a floor, not a ceiling
The most defensible practice in the Indian context is to treat the 20 percent savings figure as a non-negotiable floor and let the actual savings rate float higher when needs and wants permit. The 50 and 30 percent figures then become ceilings, not targets to fill. Reframing the rule this way solves most of its limitations without throwing out the simplicity.
Tools and Apps That Help Indian Earners Run This Budget
The market for budgeting tools in India has matured. The right tool depends on how the household manages payments, how much manual tagging the user tolerates, and whether the data sits inside a single bank or across many.
Spreadsheets remain the most flexible option
A simple Google Sheet or Excel workbook with one row per expense, one column for category, and a pivot or filter view by bucket is still the most flexible setup. The downside is the manual entry; the upside is full visibility and zero data leakage.
Bank and UPI app statements
Most Indian banks now categorise spending inside the mobile app. The categorisation is rough but usable for a quick check against the buckets. UPI providers like PhonePe, GPay, and Paytm also generate monthly category summaries; cross-checking these against the salary account view gives a reasonable composite picture.
Dedicated personal-finance apps
Apps in the dedicated personal-finance category aim to merge UPI, credit card, and bank statement data into a single dashboard. Useful features include automated category tagging, recurring-expense detection, and goal-tracking. The data-privacy posture and SEBI or RBI registration status of any such app deserve a careful look before granting account-aggregator consent.
A weekly five-minute review
Tools matter less than the cadence. A five-minute review every Sunday, comparing the running spend in each bucket to one quarter of the monthly envelope, is enough to catch a runaway category before month-end. The household-level habit is the leverage point, not the choice of app.
FAQ
Should the 50-30-20 rule be calculated on gross salary or take-home pay in India?
It should be calculated on take-home pay, the net amount that lands in the salary account after EPF, professional tax, and TDS. Calculating on gross salary or CTC overstates spending capacity by 15 to 30 percent and produces an unrealistically low effective savings rate. The actual bank credit, averaged over three months, is the defensible base.
What if rent in Mumbai or Bengaluru already takes 40 percent of my take-home?
A temporary 60-25-15 split is the standard adjustment. Needs absorb 60 percent, wants drop to 25 percent, and savings hold at 15 percent. The savings rate stays above the commonly cited 15 percent floor for personal finance, and the discretionary bucket takes the hit rather than the savings bucket. The plan is to revisit each year as income rises or housing costs moderate.
Does the 20 percent savings include EPF and PPF contributions?
For budgeting clarity, the 20 percent should refer to voluntary savings and investments over and above the EPF deduction that already reduces take-home. Counting EPF inside the 20 percent inflates the apparent savings rate without changing actual cash flow. PPF, NPS, and mutual fund SIPs paid from the bank account after salary credit do belong inside the 20 percent.
Can the rule work for a freelancer or business owner with variable income?
Yes, with one adjustment. The base is the average monthly post-tax income over the last twelve months, not any single month. Months with above-average income overflow into a separate buffer account; months with below-average income draw from that buffer. The buckets stay the same; only the source of the monthly base changes.
How often should the rule be reviewed and re-balanced?
A light review every month and a structural review every twelve months. The monthly review checks whether spending stayed within the envelopes. The annual review re-bases take-home for any salary change, re-tags categories, adjusts the metro premium if rent or city has changed, and decides whether to push the savings rate higher. Major life events like marriage, a new dependent, or a home loan trigger an immediate re-balance.
Related guides on this topic are coming to learnfinedge.com soon.