

The Unified Payments Interface has done something remarkable in India over the last decade. It has made paying for anything a two-tap exercise, with monthly transaction volumes regularly above 10 billion across the system per NPCI statistics, and the share of the household budget that flows through cash has shrunk dramatically. The flip side is that monitoring where the money goes has become harder, not easier, because there are now ten or twenty UPI transactions a day instead of one or two visits to the ATM. A reliable upi spend tracker india setup has become essential for any salaried earner trying to maintain a household budget.
This guide covers five practical, zero-cost methods to track UPI spends in 2026 using tools the household already has: the BHIM transaction history, Google Pay insights, PhonePe statements, the bank app’s UPI history, and a simple spreadsheet pulling all three together. Each method is explained step by step with a short note on privacy considerations and what to watch for. None of these requires a paid app, and none requires giving up account-aggregator consent to a third party.
Why UPI Has Made Spend Tracking Both Easier and Harder
The shift from cash to UPI changed the spend-tracking problem in two opposing ways. On one hand, every transaction now has a digital record with timestamp, recipient name or merchant identifier, and amount, which is much better than the cash era. On the other hand, the sheer volume of small transactions has multiplied, which makes mental tracking impossible and demands a structured approach.
UPI volumes in India have grown rapidly over the past several years per NPCI monthly statistics, with a meaningful share of growth coming from very small-value transactions. The shift in the consumer mix means a typical urban household now generates 200 to 400 UPI transactions a month across all family members.
The classic budgeting problem in a UPI world
The 50-30-20 budgeting framework assumes the household can attribute every rupee to one of three buckets at the end of the month. In a 30-transaction-a-month world, that attribution is tractable manually. In a 300-transaction-a-month world, it requires either an app or a process. Most households default to neither and lose budgeting discipline by default.
What “spend tracking” actually means at the household level
Spend tracking at the household level is the practice of categorising every outflow into a small set of buckets (food, transport, utilities, shopping, entertainment, transfers, savings) and running a monthly total against a target for each bucket. The categorisation does not have to be perfect; it has to be consistent enough that month-on-month comparisons are meaningful.
Why “free” matters in the choice of tool
Many budgeting apps in India are free at the surface and monetise through data sharing, account-aggregator consent, or eventual upsells. A method that uses tools already in the household’s payment stack avoids that exchange entirely. The information is more useful when the user knows exactly where it sits and who has access.
Method 1: BHIM App Transaction History and Categorisation
The BHIM app, built and maintained by NPCI, is the reference implementation of UPI for India and offers one of the cleanest transaction histories available because it stays close to the underlying UPI data structure.
Step by step
- Open the BHIM app and authenticate.
- Navigate to the Transaction History or “Bank Account” section, depending on app version.
- Filter by date range (last 7 days, last 30 days, or custom range).
- For each transaction, note the recipient name or merchant identifier, the amount, and the date.
- Export or share the history as a PDF or text where the option exists; otherwise screenshot or copy the data into a spreadsheet.
- Tag each transaction in the spreadsheet against one of the household’s standard categories.
What BHIM does well
The BHIM history captures the underlying UPI transaction in clean form: the Virtual Payment Address (VPA) of the recipient, the amount, the date, and a reference number. The recipient VPA usually contains a merchant identifier (a fragment of the merchant’s name or service category), which makes manual categorisation faster than a pure date-and-amount view.
What BHIM does less well
BHIM does not auto-categorise transactions, and it does not display a spend dashboard. The history is a list, not a chart. For households that prefer a category breakdown out of the box, BHIM alone is not enough; pairing it with a spreadsheet (Method 5) fills the gap.
Best use case
BHIM is the cleanest source for cross-verification when other apps show inconsistent data, and it is the default option for users who want a tool maintained by the same entity (NPCI) that runs UPI itself. It is the steadiest reference point in any multi-app tracking setup.
Method 2: Google Pay Insights and Monthly Statements
Google Pay remains one of the most-used UPI apps in India and has built a category-level insights feature that does the auto-tagging that BHIM does not.
Step by step
- Open Google Pay and navigate to the profile section.
- Select “Activity” or “Manage” depending on app version.
- View the month-on-month summary that breaks transactions into broad categories like Food & Drinks, Shopping, Bills, and Transport.
- Tap into any category to see the underlying transactions and a list of merchants.
- Adjust any miscategorised transaction by long-pressing and selecting the right category.
- For longer-term tracking, download the monthly statement as a PDF or CSV where available.
What GPay does well
The auto-categorisation is genuinely useful. Most large merchants (Zomato, Swiggy, BMTC, BluSmart, Amazon Pay merchants) are correctly tagged most of the time, which removes the manual step that BHIM requires. The category dashboard offers a quick visual of where money is going without any spreadsheet work.
What GPay does less well
The categorisation can be wrong for smaller merchants and informal sellers (local kirana, neighbourhood vegetable vendor, freelance professional VPAs), where the merchant identifier is generic. Manual corrections persist within the app but do not always export cleanly to a CSV.
Best use case
For users whose UPI activity is concentrated in well-known merchants and who want a quick monthly summary without spreadsheet work, GPay insights are the easiest first stop. For households with a high share of person-to-person and informal-merchant payments, GPay should be paired with another method for completeness.
Method 3: PhonePe Expense Tracker
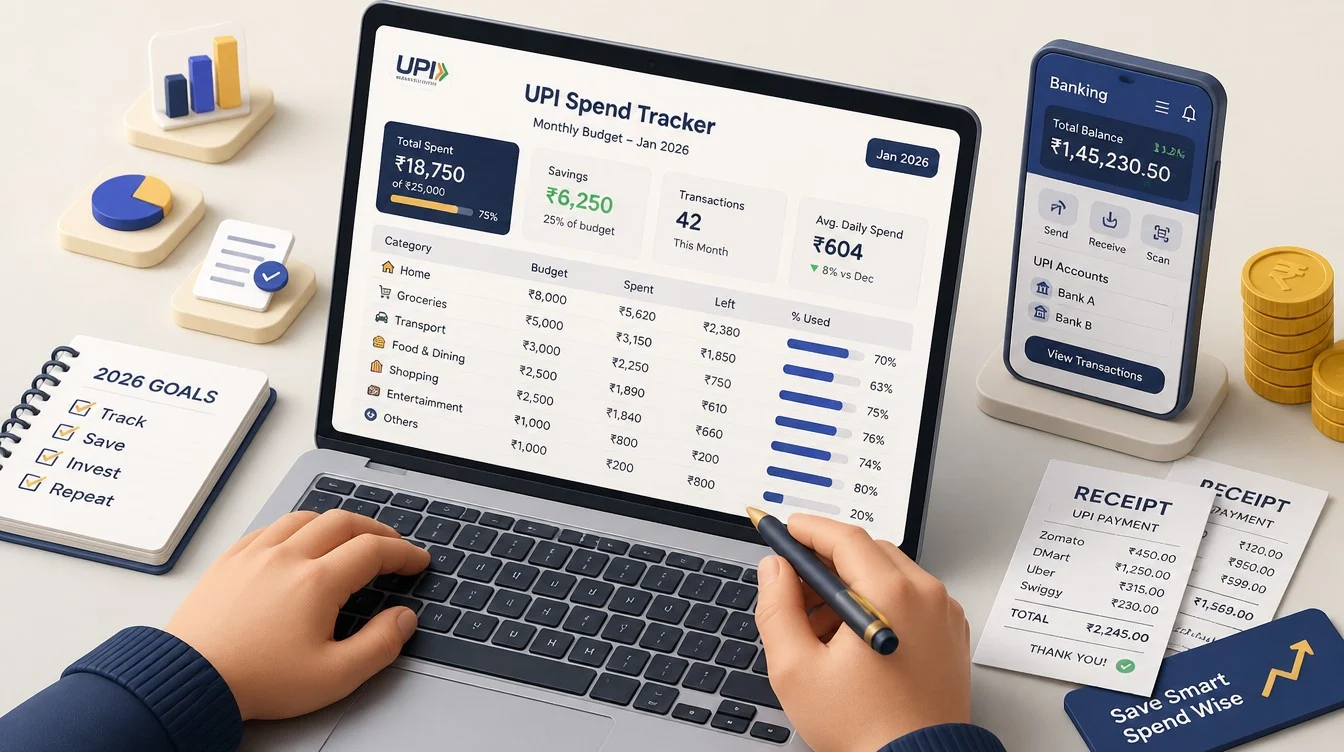
PhonePe has built its own expense-tracker feature inside the app, which aggregates UPI activity into category-level and day-wise summaries.
Step by step
- Open PhonePe and navigate to the My Money or Expense Tracker section, depending on app version.
- Allow the app to read transaction history if prompted.
- View the monthly summary showing incoming, outgoing, and net cash flow across categories.
- Tap into individual categories to view underlying transactions.
- Set a monthly budget by category if the user wants alerts when a threshold is approached.
- Download or export the monthly statement for archival.
What PhonePe does well
The day-wise breakdown is a useful complement to the category view because it surfaces spending patterns (e.g., spending spikes on weekends or paydays) that a pure category view hides. The budget-alert feature is also a nudge that other free apps do not offer.
What PhonePe does less well
The tracker only sees PhonePe-routed transactions. UPI payments made through other apps (GPay, BHIM, Paytm, the bank’s own app) do not appear, which can give a partial picture for households that spread their UPI usage across apps. Users who concentrate on PhonePe get the most value.
Best use case
For users whose UPI activity is concentrated in PhonePe, the in-app tracker is sufficient as a stand-alone solution. For multi-app users, the tracker is one input among several and needs to be combined with statements from the other apps used.
Method 4: Bank App UPI History and Account Statement
The bank’s own mobile app provides the most comprehensive view because every UPI payment, regardless of the app used to initiate it, eventually shows as a debit in the bank account.
Step by step
- Open the bank’s mobile or net banking app.
- Navigate to Account Statement or Transaction History.
- Filter by date range and by transaction type (UPI / IMPS / NEFT) where the filter is available.
- Download the statement in PDF or CSV format. Most major Indian banks now support CSV download for at least 12 months of history.
- Open the CSV in a spreadsheet, sort by amount or by date, and tag transactions against household categories.
- Cross-reference any unclear merchant against the UPI app’s history for the same date and amount.
What the bank app does well
The bank statement is the canonical source. It captures every payment regardless of the UPI app used, includes salary credits, EMI debits, NEFT and IMPS transfers, and any direct debits. For comprehensive monthly tracking, the bank statement is the only source that does not miss anything.
What the bank app does less well
The merchant identifier is usually less informative than in the UPI apps. The bank statement may show “UPI/
Best use case
The bank app is the primary monthly source. The recommended cadence is to download a CSV at the end of each month, tag it once, and use it as the authoritative record for that month’s spend analysis. The UPI apps then serve as supplementary tools for identifying unclear entries.
Method 5: A Simple Spreadsheet That Pulls It All Together
The fifth method ties the previous four together. A single spreadsheet with a few columns, refreshed monthly, is the closest thing most households have to a dedicated personal-finance application without the privacy trade-off.
Step by step
- Create a Google Sheet or Excel workbook with one tab per month.
- Set up columns for Date, Description, Amount, Category, Sub-Category, and Notes.
- At month-end, download the bank statement CSV and paste into the sheet.
- Use a category-tagging helper (a simple lookup formula like VLOOKUP or XLOOKUP against a “rules” sheet of merchant-to-category mappings) to auto-tag known merchants.
- Manually tag any new merchants and add them to the rules sheet so the next month’s tagging is faster.
- Build a pivot table that sums transactions by category for the month and compares against the household’s target budget.
What the spreadsheet method does best
The spreadsheet is fully under the household’s control. There is no third-party data sharing, no consent paperwork, no privacy concern beyond the cloud provider used (if Google Sheets), and the format can evolve over years with no risk of the app shutting down. Pivot tables and year-on-year comparisons are easier in a spreadsheet than in any free in-app dashboard.
What the spreadsheet method does less well
It requires a setup time of one or two hours initially and a monthly maintenance time of roughly 15 to 30 minutes. The auto-tagging only works for merchants the household has already encountered, so the first three months involve more manual classification.
Best use case
The spreadsheet is the long-term home. The other four methods feed into it. For households serious about budgeting over multiple years, the spreadsheet is the single most durable artefact because it survives any change in payment app preferences or banking relationships.

A Pros and Cons Comparison Across the Five Methods
Each method has a different strengths-and-weaknesses profile. The comparison table below summarises the trade-offs.
| Method | Auto-categorisation | Captures all UPI activity | Privacy posture | Effort to maintain | Best fit for |
|---|---|---|---|---|---|
| BHIM transaction history | No | Only BHIM-initiated | NPCI, single jurisdiction | Medium | Cross-verification, BHIM-primary users |
| Google Pay insights | Yes, partial | Only GPay-initiated | Google, multi-jurisdiction | Low | Quick monthly summary, GPay-primary users |
| PhonePe Expense Tracker | Yes, partial | Only PhonePe-initiated | Walmart-owned, single jurisdiction | Low | Day-wise pattern view, PhonePe-primary users |
| Bank app statement | No | Yes, all UPI plus other debits | Bank only | Medium | Comprehensive monthly source of truth |
| Spreadsheet aggregating all sources | Yes, user-defined rules | Yes, by design | User-controlled | Medium-high | Long-term budget tracking and analysis |
Picking the right combination
Most households end up using two methods together: the bank statement as the primary monthly source and one of the UPI apps for category context. The spreadsheet is the long-term archive. The three layers between them cover monthly accuracy, category attribution, and multi-year analysis without paying any third-party app a rupee.
What the comparison does not capture
The comparison does not capture user preference, which often matters more than the technical differences. A method the user opens twice a week beats a more sophisticated method opened once a quarter. Picking the methods the household actually uses, not the methods that are theoretically superior, is the more important decision.
Category Auto-Tagging Tips for Indian Spending Patterns
The single biggest time saver in any tracking setup is consistent category auto-tagging. A short list of conventions makes month-over-month tracking far more reliable.
The household’s category list
The defensible default list for an urban Indian household is: Rent and Utilities, Groceries, Food & Dining, Transport, Healthcare and Insurance, Education, Shopping, Subscriptions, Entertainment and Travel, Personal Transfers, EMIs, and Savings. Twelve categories is enough granularity to drive decisions without becoming unwieldy.
Merchant identifier patterns
Common merchant identifiers in UPI payments include “zomato”, “swiggy”, “amazon”, “flipkart”, “ola”, “uber”, “rapido”, “bigbasket”, “blinkit”, “instamart”, “zepto”, “irctc”, “redbus”, “myntra”, “ajio”, “tata”, and “phonepe”. Building a lookup table that maps each of these to a household category accelerates auto-tagging dramatically.
The GST distinction in receipts
For households running a side business or freelance work, separating personal and business spending is essential. UPI receipts now commonly include GSTIN where the merchant is registered. Filtering merchants by whether the receipt contained a GSTIN can help separate business-expensable spending from personal spending; the actual GST input credit handling sits with the household’s chartered accountant.
The “transfers” category nuance
Person-to-person UPI transfers (to family, friends, domestic help) are often the largest single category in an Indian household, and they distort any budget if lumped with discretionary spending. The clean treatment is a dedicated Transfers category, with sub-tags for Salary & Wages Paid, Family Remittance, and Reimbursements Received.
Avoiding over-categorisation
The temptation is to split every category into five sub-categories. The result is usually paralysis: the user does not know which sub-category to pick and stops tagging. Starting with 10 to 12 top-level categories and adding sub-categories only where the volume justifies it is the more durable approach.
Privacy Considerations When Tracking UPI Spends
UPI transaction data is sensitive because it reveals income, spending patterns, household structure, and lifestyle preferences in unusual detail. Any tracking method has to be evaluated on what it does with the data, not only on its features.
What the UPI apps already see
Every UPI app sees the transactions initiated through it, by design, because that is how UPI works. The differences across apps lie in what is done with that data: whether it is used purely for service operation, whether it is enriched with third-party data, and whether it is offered to advertisers or used for credit scoring. The privacy policies of the major UPI apps are published and worth a five-minute read at least once.
The account-aggregator consent risk
Some third-party budgeting apps ask the user to give account-aggregator consent under the RBI’s account-aggregator framework. This gives the app structured access to bank statements across multiple banks. The framework itself is regulated, but the use of the data once aggregated depends on the app. For privacy-conscious users, the simpler methods above (statement download, in-app tracker, spreadsheet) avoid the aggregator chain entirely.
Cloud storage considerations
A Google Sheet on a personal Google account inherits the privacy posture of that Google account. For users uncomfortable with cloud storage of detailed spending data, the equivalent Excel workbook on a local drive is a reasonable alternative. Encrypted local storage takes one extra setup step but resolves the cloud concern.
Sharing the spreadsheet within the family
For household budgeting, the spreadsheet usually needs to be shared between spouses or partners. Granting view-only access to a partner’s verified email, rather than copying the data into multiple places, keeps the data perimeter clean.
Building a Monthly Spend-Tracking Habit
The tool matters less than the habit. A simple monthly rhythm makes the tracking actually useful.
The 30-minute monthly review
Set aside 30 minutes on the first weekend of each month. Download the previous month’s bank statement, run the auto-tag pass in the spreadsheet, manually tag the remaining transactions, and look at the category totals. The review should answer one question: did any category surprise the household.
The quarterly trend review
Once a quarter, look at the trend across the last three months for the top five categories. Trends that go up by more than 15 percent without a deliberate reason are candidates for action. Trends that go down without explanation are usually not worth investigating further.
The annual benchmarking review
Once a year, compare the full year’s category breakdown to the previous year. Compare against headline CPI from RBI bulletins; categories that grew much faster than CPI are lifestyle creep candidates. The annual review is also the right moment to update the category list and the merchant rules sheet.
What to do with the insights
Insights without action are noise. The clean rule is: each monthly review must produce at least one specific decision, even if the decision is to leave things unchanged. The decision can be a category cap (e.g., dining capped at Rs.6,000 next month), a subscription cancellation, or a re-balancing toward savings. Action turns tracking into budgeting.
FAQ
Do I need a paid budgeting app to track UPI spends?
No. The bank statement, the UPI app in-built insights (GPay, PhonePe, BHIM), and a personal spreadsheet together cover most household budgeting needs without any subscription cost. Paid apps offer convenience features like cross-bank aggregation, but the same outcomes are achievable manually with a monthly 30 to 60 minute time investment.
Which UPI app has the best built-in tracking in 2026?
Google Pay and PhonePe both offer category-level dashboards and monthly summaries. PhonePe’s day-wise view is useful for detecting spending spikes; GPay’s category accuracy is strong for large merchants. For users who concentrate their UPI activity in a single app, either is sufficient. For multi-app users, the bank statement remains the canonical source.
How long should I keep UPI transaction history archived?
Most banks make at least 12 months of statement history downloadable as PDF or CSV. For household budgeting, three to five years of archived monthly statements is enough to support meaningful year-on-year analysis. For tax purposes, retaining records aligned with the Income Tax Department’s reassessment timelines is the safer default, particularly for any UPI transactions related to business income.
Do UPI apps share my spending data with credit bureaus or lenders?
UPI apps operate under RBI and NPCI regulation and have their own privacy policies that describe what data is used for what purpose. Some apps offer credit products and may use UPI activity in their own credit evaluation; sharing with external credit bureaus typically requires explicit consent. Reading each app’s privacy policy at least once is the only reliable way to know.
What if I want one combined dashboard across all my UPI apps and banks?
A combined dashboard usually requires either a third-party app with account-aggregator consent (regulated by RBI under the account-aggregator framework) or a manual aggregation in a spreadsheet. The spreadsheet approach trades some convenience for full control and zero third-party access. Aggregator-based apps offer more polish but require trust in the app’s handling of the consolidated data.
Related guides on this topic are coming to learnfinedge.com soon.