
The number a buyer most wants to see on a health-insurance policy comparison page is the claim settlement ratio. The number that actually predicts whether a hospital bill will be paid without a fight, however, is rarely the headline percentage. The IRDAI’s FY 2024-25 disclosures, released as part of the Annual Report and individual insurer data, finally let buyers separate the genuinely fast settlers from the merely well-marketed ones.
This guide ranks the top ten Indian health insurers by their FY 2024-25 claim settlement ratio, walks through how the IRDAI computes that ratio, and shows why the incurred claim ratio tells a complementary story that buyers usually miss. By the end, the health insurance claim ratio india 2026 conversation should make sense not just as a single percentage but as a small dashboard of four numbers that together describe how an insurer behaves.
Policies are bought in months and remembered in hours when a relative is in an ICU, and the ratios below are the closest thing the regulator gives buyers to a track record. They are not a guarantee of how any specific future claim will be handled, but they are the most defensible objective signal available in 2026.

What “Claim Settlement Ratio” Actually Measures
The claim settlement ratio in IRDAI disclosures is the percentage of claims an insurer settled within three months of receiving the complete claim file, expressed as a share of the total claims reported in that financial year. The metric exists because the policyholder grievance most likely to land in front of the Insurance Ombudsman is not outright denial but indefinite delay, and the three-month cut-off is the regulator’s working definition of “timely”.
What the number includes
The CSR includes both cashless settlements at network hospitals and reimbursement claims after discharge. It includes partial payouts where the insurer paid the cleared portion and contested the rest. It does not include claims still in the open queue at financial year-end, which roll forward to the next year’s denominator.
What it does not measure
The headline ratio does not tell you what the average payment-to-billed-amount percentage was. An insurer can settle 99 percent of claims within 90 days while routinely paying only 70 percent of the billed amount through aggressive deductions on consumables, room-rent sub-limits, and non-listed expenses. The CSR also does not measure customer satisfaction with the cashless authorisation experience, which is where most front-line frustration originates.
Why three months matters for the buyer
For a family financing an unexpected hospitalisation through a credit-card swipe or a quick personal loan, the gap between a 30-day and a 90-day reimbursement is the difference between a manageable interest bill and a stressful one. The three-month settlement metric matters most for reimbursement claims; cashless settlements, when they go through cleanly, complete in hours.
FY 2024-25 Health Insurance Claim Ratio: The Top 10
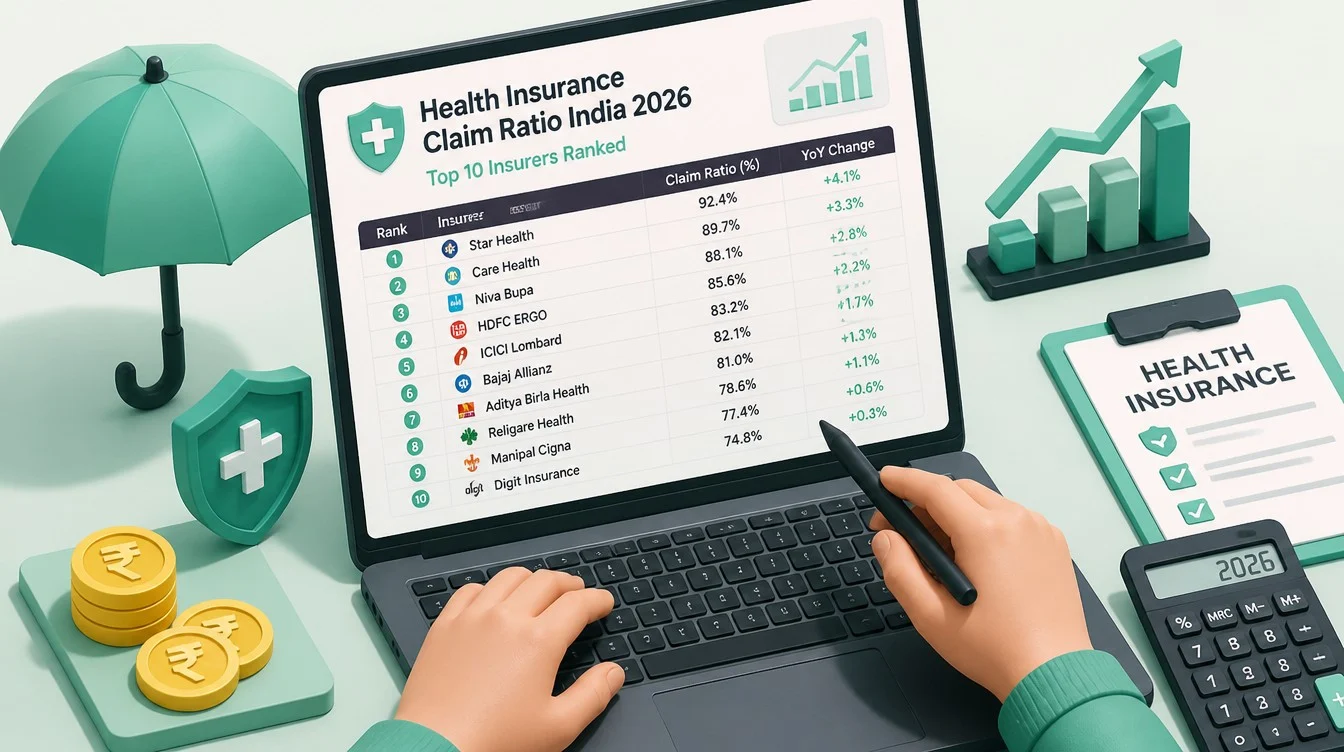
The table below summarises FY 2024-25 claim settlement ratios disclosed by IRDAI for ten of the most widely held health-insurance providers in India, mixing standalone health insurers with general-insurance providers that write health business. Numbers refer to claims settled within three months as a percentage of total claims reported in the year.
| Rank | Insurer | Category | FY 2024-25 CSR (within 3 months) |
|---|---|---|---|
| 1 | Acko General Insurance | General | ~99.98% |
| 2 | Aditya Birla Health Insurance | Standalone Health | ~100% |
| 3 | Galaxy Health Insurance | Standalone Health | ~100% |
| 4 | Narayana Health Insurance | Standalone Health | ~100% |
| 5 | Niva Bupa Health Insurance | Standalone Health | ~100% |
| 6 | Reliance General Insurance | General | ~99.32% |
| 7 | Star Health and Allied Insurance | Standalone Health | ~99.06% |
| 8 | HDFC ERGO General Insurance | General | ~98.85% |
| 9 | ICICI Lombard General Insurance | General | ~98.45% |
| 10 | United India Insurance | Public Sector | ~95.26% |
Reading the table without over-reading it
Four standalone health insurers reporting close to 100 percent settlement within three months is a meaningful shift versus older data, and it reflects both genuine process improvement and the regulator’s ongoing pressure on turnaround times. Public-sector general insurers cluster at the lower end, around 91 to 95 percent, which is still a high absolute number but reflects older claims-handling architectures.
What is missing from the table
Several large insurers report on slightly different bases (some on claim count, some on claim amount), and not every disclosure aligns to the same denominator. Treat the ranking as directional rather than as a precise league table. The insurers in the top half are clearly faster settlers than the bottom half, but small differences between adjacent rows are not significant.
Standalone health vs general insurers
Standalone health insurers (SAHIs) tend to specialise in health-only books, which gives them deeper claims-handling expertise on health-specific cases. General insurers cross-subsidise across motor, fire, marine, and health, and their health-claims operations can be a smaller share of the overall business. Both can be excellent; the operational specialism of an SAHI is worth weighing for buyers who anticipate complex chronic-disease claims.
The Incurred Claim Ratio: The Number Insurers Quietly Hate
The incurred claim ratio (ICR) is the percentage of premium an insurer paid out as claims during the year. An ICR of 65 percent means that for every Rs.100 collected as premium, the insurer paid Rs.65 in claims. The IRDAI publishes ICR figures for each insurer in its Annual Report.
Why a low ICR is not always good news for the buyer
An insurer with an ICR below 50 percent is either dramatically over-pricing the cover, aggressively rejecting valid claims, or under-paying settled claims through tight deduction discipline. None of these are buyer-friendly outcomes. A reasonable ICR in the Indian health-insurance market sits in the 65 to 90 percent band; numbers far below this band warrant scrutiny.
Why a very high ICR is also a warning
An ICR above 100 percent for several consecutive years signals that the insurer is paying out more in claims than it collects in premium, which is a financial-stability concern. Public-sector general insurers periodically run at elevated ICRs because of legacy group books and high-cost portfolio segments. A persistently above-100 ICR usually presages a premium hike or product redesign.
The CSR-plus-ICR combination
The most informative pairing is a CSR above 95 percent combined with an ICR in the 65 to 85 percent band. That combination suggests the insurer is settling most claims on time and paying out enough relative to premium that aggressive deduction is not the default. Insurers that meet both bars are usually safe institutional choices, even before brand or distribution considerations are factored in.
Beyond The Ratio: Five Operational Metrics That Decide Your Experience
Even within the cluster of insurers reporting 99-plus CSR, the actual buyer experience varies meaningfully. These five metrics often matter more than the headline ratio on a per-claim basis.
- Cashless network depth and quality: The number of network hospitals matters less than whether the top three or four hospitals you would actually use are in network, including the closest tertiary-care centre to your home.
- Average cashless authorisation turnaround: The time from claim intimation to authorisation at admission. A high-CSR insurer that needs five hours to authorise admission on a Friday evening is still painful at point of service.
- Claim deduction percentage: The average gap between the billed amount and the approved amount. Aggressive deductions on room-rent proportional clauses or non-listed consumables can convert a 99-percent CSR into a poor outcome on a specific case.
- Grievance redressal time: The Ombudsman discloses how often each insurer has cases escalated. Lower escalations typically signal cleaner downstream operations.
- Reinstatement and No-Claim-Bonus handling: Insurers that erode NCB sharply on a single small claim, or that take a long time to reinstate cover after exhaustion, deliver a worse multi-year experience than the headline ratio suggests.
Why the network list deserves a hard read
Many buyers scan the network-hospital count without checking whether their preferred tertiary hospital is on the list, on the empanelled-with-tariff list, or on neither. The first means clean cashless; the second means cashless with a negotiated tariff floor; the third means reimbursement only. Reimbursement claims have a longer settlement clock and consume more of the family’s financial cushion at the worst possible time.
Where pre-authorisation experience really breaks
The most common operational failure on a high-CSR insurer is delayed pre-authorisation in late-evening or weekend admissions, where the third-party administrator’s desk is thinly staffed. Asking an insurer or broker about the 95th-percentile pre-authorisation time, not the average, is a useful disambiguating question. Averages hide the long-tail experiences that anchor buyer regret.
How sub-limits quietly erode the headline number
Room-rent capping, ICU sub-limits, and disease-wise caps on procedures such as cataract surgery or knee replacement can convert a high CSR into a low actual-recovery percentage. A policy that pays “100 percent of admissible expenses” but caps room rent at 1 percent of sum insured ends up paying a much smaller share of a high-end hospital’s actual bill.

How To Read An Insurer’s Annual Disclosure
Every insurer’s public disclosure has a few sections worth opening directly rather than relying on aggregator summaries. The disclosures are dry but answer the questions most marketing pages avoid.
The Public Disclosures (NL-25, NL-27, and equivalents)
IRDAI mandates quarterly and annual public disclosures that list claims paid, claims rejected, claims pending, and claims repudiated, broken down by ageing bucket. The annual disclosure (often filed as NL-25 or equivalent for general insurers) typically includes a claims-by-ageing table that lets you compute the share settled within 30, 60, and 90 days. A buyer interested in genuine speed should look beyond the regulator’s three-month cut-off to the share settled within 30 days.
The grievance data
Each insurer reports the number of grievances received, resolved, and pending, with a separate count of escalations to the Insurance Ombudsman. The escalation count, normalised by the policy base, is a clean signal of operational health. An insurer with a 99-percent CSR but a high escalation rate is settling claims but leaving customers unhappy enough to formally complain.
Solvency margin and financial strength
The solvency ratio (regulatory minimum 150 percent) is the most basic financial-stability metric. Most large insurers run comfortably above 175 percent. Persistent operation near the 150 percent floor is a red flag for buyers committing 10 to 20 years of premium to an insurer, because financial stress eventually affects claims handling at the operational level.
The Channel Effect: Why The Same Insurer Performs Differently Through Different Channels
An insurer’s published CSR is an institution-wide average. The actual buyer experience can vary depending on whether the policy was bought through a direct insurer-app, a web aggregator broker, a bank-relationship-manager-led sale, or an offline agent. Each channel has a different downstream support intensity.
Direct insurer purchase
Buying directly from the insurer’s app or website means no broker intermediary at claims time. The advantage is single-point ownership; the disadvantage is that during a claim event the buyer has no advocate other than the insurer’s own grievance desk. For tech-comfortable buyers, this is usually fine.
Broker-led purchase
A licensed broker, including modern digital brokers, typically provides an account-management layer that helps with claim escalation. The premium is the same as direct purchase (commission is built into the IRDAI-approved rate, not added on top), and the value of broker support during a contested claim can be meaningful. The downside is that broker quality varies widely.
Bank or RM-led purchase
Bank-led health-insurance sales often suffer from the same product-knowledge gap that affects bank-led mutual-fund and ULIP sales. The relationship manager may not be the right person to help during a contested claim. For complex family covers, this channel is typically the weakest at the claims stage even if the insurer underneath is excellent.
Group cover from an employer
Employer-sponsored group health cover is operationally distinct: claims handling is mediated by the HR-appointed broker or TPA, and the insurer’s published CSR may not reflect the group claims experience because group books are reported separately. For employees, the operational experience depends as much on the broker the employer hired as on the insurer behind the cover.
Common Mistakes Buyers Make With Ratios
The ratio is a starting filter, not a buying decision. These are the recurring mistakes that lead buyers astray.
- Picking the highest CSR without checking sub-limits. A 100-percent CSR on a sub-limited product can mean small payouts settled fast.
- Ignoring the ICR entirely. An insurer with a 99-percent CSR and a 45-percent ICR is likely settling fast and paying little; sustained low ICR usually means tight deductions.
- Trusting one financial year’s ratio. Look at three consecutive years. Single-year ratios can be flattered by closing the book aggressively at year-end.
- Conflating life-insurance CSR with health CSR. Life insurers report a separate CSR for term-policy death claims, which runs above 98 percent for most large insurers. This is not comparable to health CSR.
- Comparing standalone health and general insurers without adjusting. SAHIs handle only health claims, while general insurers handle health within a broader claims mix; the operational depth can differ.
The “company X rejected my friend’s claim” anecdote
Individual anecdotes are over-represented in family WhatsApp groups and do not generalise. A single rejected claim within a 99-percent CSR distribution is consistent with the published number; one-percent rejection over a million claims is ten thousand stories. The institutional record is more reliable than any individual story, but the institutional record itself is incomplete without ICR, sub-limit, and grievance data.
The “buy the cheapest at this CSR” trap
Two policies at similar CSR can have meaningfully different feature sets: pre- and post-hospitalisation coverage windows, room-rent terms, disease-wise sub-limits, restoration benefit on partial exhaustion, NCB structure, and coverage of consumables. Two policies at the same CSR can differ by 15 to 30 percent on real-world recovery; the cheaper one usually has tighter terms.

A Checklist For Picking An Insurer In 2026
Walk through this checklist in order. Each step narrows the candidate set before brand or premium considerations come in.
- Filter for CSR above 95 percent in the latest IRDAI annual disclosure. This is the floor for serious consideration.
- Filter for ICR between 65 and 90 percent over the latest three years. Outside this band is a warning.
- Check that your closest two hospitals are in the cashless network with full empanelment (not tariff-restricted).
- Read the room-rent and ICU sub-limit clauses. Prefer products with no room-rent capping for the cover size you plan to buy.
- Verify the restoration benefit terms. A clean restoration that triggers on partial exhaustion (not full exhaustion) is materially more valuable.
- Check the No-Claim-Bonus structure. A cumulative NCB up to 50 to 100 percent is the floor; faster ramp-ups are increasingly available.
- Read pre- and post-hospitalisation expense coverage windows. 60 to 90 days pre and 90 to 180 days post are reasonable; tighter windows hurt at claim time.
- Check the IRDAI-mandated PED waiting-period structure. The 2026 IRDAI cap is three years on pre-existing-disease waiting periods.
- Read the grievance data in the annual disclosure. Low escalation per policy is the cleanest signal of operational health.
- Confirm solvency margin above 175 percent. Financial stability ultimately underpins claims handling.
When to prefer a brand premium
If two insurers tie on the technical checklist, paying a 10 to 15 percent premium for the institutionally stronger brand is usually defensible for a long-tenure relationship. The cost is small relative to the comfort of dealing with a well-resourced grievance team during a contested claim.
When the cheapest defensible option is fine
For young, single buyers with no pre-existing conditions buying a base Rs.10,00,000 (10 lakh) cover, the technical checklist usually leaves several reasonable choices and the cheapest defensible option works. Complexity rises with family floaters, senior-citizen covers, and chronic-disease histories, where the brand and broker-support premium starts to earn its keep.
Frequently Asked Questions
What is a good claim settlement ratio for a health insurance company?
A CSR above 95 percent within three months is the working floor for serious consideration in the Indian market. Several standalone health insurers and select general insurers now report 98 to 100 percent in FY 2024-25, which is comfortably above the floor. Below 90 percent warrants a hard look at the insurer’s grievance and ageing data.
What is the difference between claim settlement ratio and incurred claim ratio?
Claim settlement ratio is the share of claims an insurer settled within a defined window (usually three months) out of total claims reported. Incurred claim ratio is the share of premium an insurer paid out as claims during the year. CSR measures speed; ICR measures payout intensity. Both together give a fuller picture than either alone.
Are public-sector general insurers’ CSRs lower than private insurers in 2026?
On the FY 2024-25 data, public-sector general insurers cluster in the 91 to 95 percent band, while private and standalone health insurers cluster in the 98 to 100 percent band. The gap reflects differences in claims-handling architecture and book composition rather than financial strength; PSU insurers remain financially sound and have wide rural networks.
Should I switch insurers if my current one has a lower CSR than a competitor?
Switching has consequences: pre-existing-disease waiting periods restart unless ported correctly under IRDAI portability rules, and continuity benefits can be lost if the switch is mishandled. A 1 to 2 percentage-point CSR gap is rarely worth the switching risk; a 5-point or greater gap combined with a poor sub-limit structure may justify a porting decision, executed with care.
Does the published CSR cover both cashless and reimbursement claims?
Yes, IRDAI’s CSR disclosures cover both cashless and reimbursement claims. Reimbursement claims usually carry a longer average settlement time than cashless, and the three-month CSR window is most informative for the reimbursement leg. Cashless authorisations, when they go through cleanly, settle in hours rather than days.
Related guides on No-Claim-Bonus structures, claim-rejection reasons, and IRDAI portability mechanics are forthcoming on LearnFineEdge and will be linked here once published.