

ETF Investing India: The Complete Beginner to Advanced Guide for 2025
Exchange-traded funds have quietly become one of the most powerful investment tools available to Indian retail investors, yet most people still do not use them. ETF investing india has grown dramatically over the last five years, with equity ETF AUM crossing Rs 7 lakh crore as of 2025. The growth is driven by institutional investors (EPFO, pension funds) and an increasing number of retail investors who have discovered that low-cost, index-tracking ETFs often outperform actively managed mutual funds over the long term. This guide covers how ETFs work, how they differ from index funds, the main ETF categories available in India, trading mechanics, costs, and a practical framework for building an ETF portfolio from scratch.
What Is an ETF and How Does It Work in India?
An ETF (Exchange-Traded Fund) is a basket of securities that tracks an underlying index and trades on a stock exchange like a share. When you buy 1 unit of the Nifty 50 ETF, you effectively own a proportional slice of all 50 companies in the Nifty 50 index at their current index weightings. The ETF replicates the index composition by holding the same securities in the same proportions.
ETFs are listed on exchanges (NSE and BSE in India) and can be bought or sold during market hours at real-time prices, just like a company’s shares. This is the fundamental difference from a mutual fund, which is priced once a day at NAV and transactions execute at the end-of-day price regardless of when you place the order.
How ETF Creation and Redemption Works
ETFs have a unique mechanism called “in-kind creation and redemption” that keeps the ETF price close to its underlying NAV. Large institutional participants called Authorised Participants (APs) can create new ETF units by delivering the underlying basket of securities to the ETF issuer, or redeem ETF units by returning them to the issuer in exchange for the underlying securities. This arbitrage mechanism ensures that if the ETF market price deviates significantly from the NAV, APs trade to close the gap.
For retail investors, the practical implication is that ETF prices stay close to their underlying value. The gap between the market price and NAV (called tracking error) is typically very small for liquid, well-managed ETFs.
Key Terms Every ETF Investor Should Know
Before investing in ETFs, understanding these terms prevents common mistakes:
- NAV (Net Asset Value): The per-unit value of the ETF’s underlying portfolio, calculated at end of day.
- Market price: The price at which the ETF trades on the exchange during market hours. Should be close to but may differ slightly from NAV.
- Tracking error: The deviation of the ETF’s return from its benchmark index return. Lower is better.
- Tracking difference: The cumulative difference between the ETF’s NAV growth and the index’s total return over a period. Closer to zero (or negative, meaning ETF slightly beats the index) is better.
- Bid-ask spread: The difference between the buying price and selling price quoted by market makers. A wide spread increases your effective cost of trading.
- iNAV (Indicative NAV): The real-time estimated NAV published by exchanges during trading hours. Useful for assessing whether the ETF is trading at a premium or discount.
ETFs vs Index Funds: Which Should You Choose?
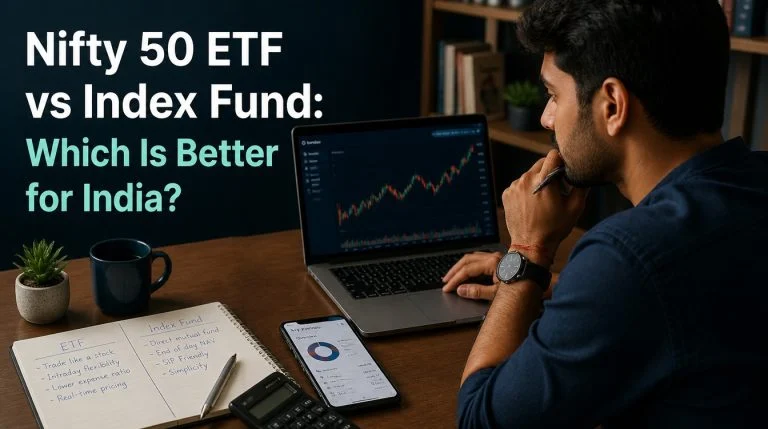
ETFs and index funds both track the same indices and offer similar returns, but they differ in important operational ways. Many investors wonder which is better – the answer depends on your investment behaviour and preferences.
| Feature | ETF | Index Mutual Fund |
|---|---|---|
| Trading | Exchange-traded, real-time price | Once-a-day NAV, no intraday trading |
| Minimum investment | Price of 1 unit (Rs 100 – Rs 500 typically) | Rs 500 SIP; Rs 1,000 lumpsum |
| Expense ratio | 0.02% – 0.20% (typically lower) | 0.05% – 0.30% (slightly higher) |
| SIP support | Limited; requires demat account | Full SIP support, automatic |
| Demat account | Required | Not required |
| Dividend handling | Dividend reinvestment not automatic | Growth option auto-reinvests |
| Tracking efficiency | Very high; usually excellent | Good; occasionally slightly worse |
| Tax on exit | Equity ETFs: STCG 20% (under 1 yr); LTCG 12.5% above Rs 1.25 lakh (over 1 yr) | Same as ETF for equity index funds |
The practical recommendation for most investors: if you invest through SIPs and want simplicity, use a direct plan index mutual fund. If you invest primarily as lumpsum and have a demat account through a discount broker, ETFs offer marginally lower costs and the flexibility of intraday pricing. The return difference between a well-run ETF and its equivalent index fund is negligible over 10+ years. The SIP vs lumpsum backtest shows that investment discipline and consistency matter more than the marginal cost difference between ETFs and index funds.

Types of ETFs Available in India
The Indian ETF market has expanded significantly beyond simple equity index tracking. Here are the major categories.
Equity ETFs: Broad Index
The most popular ETFs in India track broad market indices. Nifty 50 ETFs track India’s 50 largest companies. Nifty Next 50 ETFs track the next 50 by size. Sensex ETFs track the Bombay Stock Exchange’s 30-stock index. Nifty 100 ETFs provide broader exposure to the top 100 companies. These broad equity ETFs are the foundation of any equity ETF portfolio and offer the most liquidity and lowest tracking errors.
Equity ETFs: Sectoral and Thematic
Sectoral ETFs track specific industry segments: Banking ETFs (Nifty Bank), IT ETFs, Pharma ETFs, Infrastructure ETFs, and PSU ETFs. These allow targeted exposure to sectors you have a specific view on. However, sectoral ETFs carry concentration risk – a sector underperforming the broader market can cause significant underperformance versus a broad index ETF. They are appropriate as tactical satellite positions (10-15% of equity allocation), not as core holdings.
Equity ETFs: Factor and Smart Beta
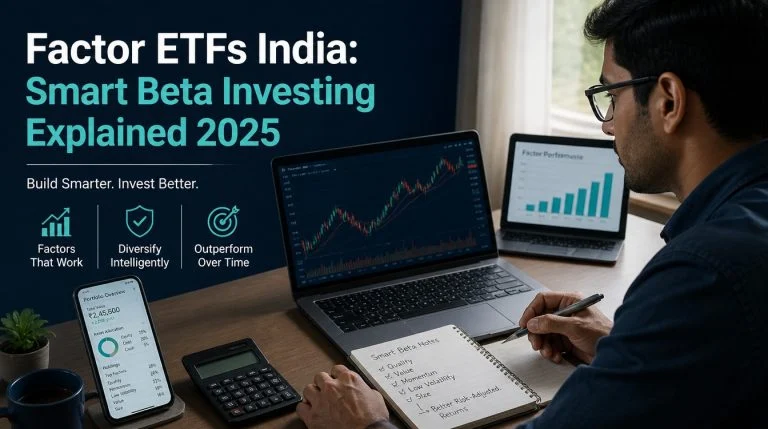
Factor ETFs tilt toward stocks with specific characteristics: Momentum ETFs (recent outperformers), Value ETFs (cheap stocks by earnings or book value), Quality ETFs (high-profitability companies), and Low Volatility ETFs. These offer a middle ground between pure passive (market cap-weighted index) and active management. They carry higher expense ratios than plain index ETFs (0.15-0.50% vs 0.02-0.20%) but still much less than actively managed funds.
Gold ETFs
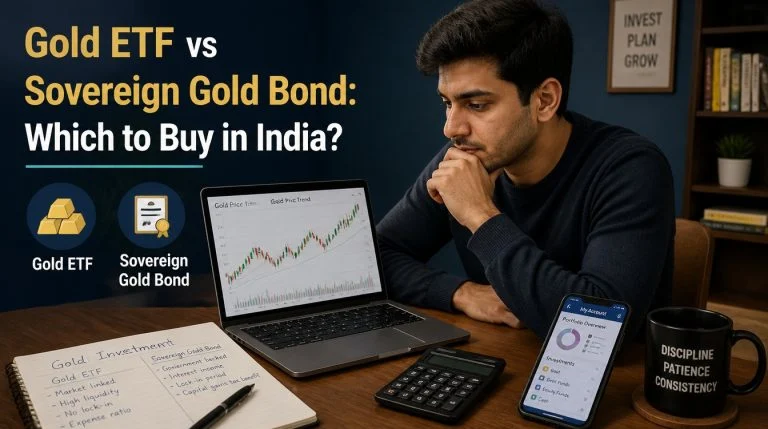
Gold ETFs hold physical gold and track the domestic gold price. Each unit of a standard gold ETF represents approximately 1 gram of gold. They eliminate storage and insurance costs of physical gold while providing returns that mirror gold price movements. Gold ETFs are listed on exchanges and trade during market hours, making them the most liquid form of gold investment. The detailed comparison of gold ETF vs sovereign gold bond vs digital gold covers the trade-offs in the gold investment space comprehensively.
Debt ETFs
Debt ETFs in India include G-sec ETFs (tracking government securities indices), Bharat Bond ETFs (investing in AAA-rated PSU bonds with fixed maturity), and liquid ETFs (very short duration). Bharat Bond ETFs have become popular because they offer defined maturity dates – you can invest knowing that you will receive returns comparable to investing in high-quality bonds until a specific date. The tax treatment changed post-2023 (same as debt mutual funds), but Bharat Bond ETFs remain useful for goal-based investing in corporate bond exposure.
International ETFs
International ETFs allow Indian investors to invest in foreign markets. These include US market ETFs (tracking Nasdaq 100, S&P 500), Hang Seng ETFs, and developed market ETFs. They provide currency diversification and access to global companies not listed in India. However, international ETF flows are regulated by SEBI’s overseas investment limits, and some international ETFs have had purchase suspensions when limits were hit. Verify the current investment limit status before investing in international ETFs. For investors interested in diversification beyond listed equities, REITs provide another route alongside international ETFs.

How to Buy and Sell ETFs in India
Buying ETFs requires three things: a demat account, a trading account, and funds. Here is the step-by-step process.
Step 1: Open a Demat and Trading Account
You need a demat account to hold ETF units and a trading account to place buy and sell orders. Discount brokers like Zerodha, Groww, and Upstox offer both accounts with minimal or zero account opening charges and low brokerage (Rs 20 per order flat or free for delivery trades). Full-service brokers also offer this facility at higher costs. Choose a SEBI-registered broker. KYC is completed digitally with Aadhaar and PAN.
Step 2: Transfer Funds to Your Trading Account
Transfer the investment amount to your trading account via NEFT, IMPS, or UPI. Most brokers offer instant fund transfer through UPI. The funds must be available before you can place buy orders.
Step 3: Search for the ETF and Review Key Data
Search for the ETF by name or symbol on your broker’s platform. Before placing the order, check:
- Current market price vs iNAV (the indicative real-time NAV)
- Today’s trading volume (higher volume means better liquidity and tighter bid-ask spreads)
- Bid-ask spread (difference between buy and sell prices)
- AUM of the ETF (larger AUM generally means better liquidity)
Step 4: Place the Order
For liquid, large-AUM ETFs (Nifty 50, Sensex, Gold ETFs), a market order is acceptable because bid-ask spreads are tight (typically 0.01-0.05%). For less liquid sectoral or thematic ETFs, use a limit order at or near the iNAV to avoid accidentally buying at a significant premium. Avoid placing large orders in ETFs with low daily volumes (under Rs 1 crore per day) – you may not get the full quantity at acceptable prices.
Step 5: Monitor and Rebalance
Once purchased, ETFs require minimal monitoring if held for long-term index exposure. The index automatically removes underperforming companies and adds new ones, so you benefit from systematic rebalancing without any action. Review your overall asset allocation annually and rebalance if equity weight has drifted significantly from target due to market movements.
ETF Costs: What You Actually Pay
The total cost of ETF investing has several components that are easy to overlook when comparing just expense ratios.
Expense Ratio
The ongoing cost deducted from the ETF’s assets. For Nifty 50 ETFs from large AMCs, expense ratios are as low as 0.02-0.05% per annum – among the lowest of any investment product in India. Gold ETFs typically have expense ratios of 0.50-0.70%. Sectoral ETFs range from 0.10-0.50%.
Brokerage and Transaction Costs
Discount brokers charge Rs 20 per order flat for ETF trades (some charge zero for delivery trades). STT (Securities Transaction Tax) applies at 0.1% of the trade value on the sell side. Exchange transaction charges, GST on brokerage, and SEBI turnover charges add a small additional amount. In total, a Rs 10,000 ETF purchase and eventual sale costs approximately Rs 50-70 in transaction charges on top of the ongoing expense ratio.
Bid-Ask Spread Cost
When you buy an ETF at the ask price and sell at the bid price, the spread is an implicit cost. For liquid ETFs with a 5 paise spread on a Rs 200 unit, this is 0.025% per round trip. For illiquid ETFs with a 50-100 paise spread, this can be 0.5-1% per round trip – a meaningful drag on performance for frequent traders.
Tax Treatment of ETFs in India (2025)
ETF taxation in India follows the standard equity or debt classification depending on the ETF type.
Equity ETFs
For ETFs classified as equity (those with 65%+ equity exposure), short-term capital gains tax (STCG) applies at 20% for units held under 12 months. Long-term capital gains tax (LTCG) applies at 12.5% for gains above Rs 1.25 lakh per year on units held over 12 months. This is the same rate as direct equity investments. Gold ETFs were reclassified as equity for the purpose of capital gains tax calculation effective from the 2024-25 assessment year – always verify the current classification with your broker or AMC factsheet.
Debt ETFs
Bharat Bond ETFs and other debt ETFs are taxed as debt mutual funds: gains are added to income and taxed at the slab rate (post-2023 Finance Act). The LTCG rate and indexation benefit no longer apply to new purchases. Understanding how different investment instruments are taxed helps you position ETFs within your overall tax-efficient portfolio construction strategy.
Building an ETF Portfolio: A Practical Approach
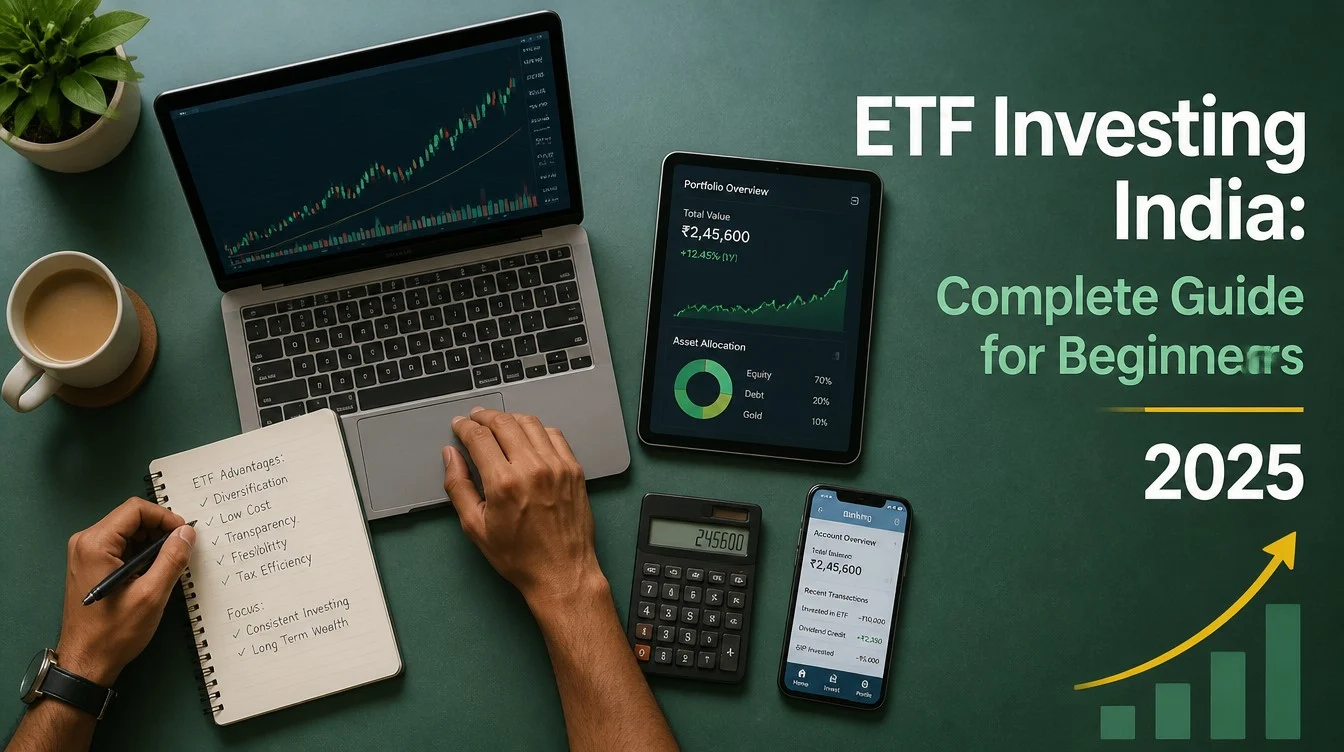
A simple, low-cost ETF portfolio for a long-term Indian investor can be built with 3-5 ETFs covering the major asset classes.
Core Equity Allocation (60-70% of portfolio)
The backbone is 1-2 broad market ETFs: a Nifty 50 ETF for large-cap exposure and a Nifty Next 50 or Nifty Midcap 150 ETF for mid-cap exposure. Together, these two ETFs give you exposure to India’s top 100-200 companies across all sectors. Combined expense ratio: approximately 0.05-0.10%.
Gold Allocation (5-10% of portfolio)
A Gold ETF provides inflation hedging and portfolio diversification. When equity markets fall, gold often rises or holds steady, reducing portfolio drawdowns. A 5-10% allocation to gold through a Gold ETF gives you the price exposure without storage or purity concerns. Sovereign Gold Bonds (SGBs) offer better long-term returns than Gold ETFs due to the 2.5% additional interest, but SGBs are less liquid and have a 5-year lock-in for early exit. Both are valid depending on your liquidity need.
International Exposure (5-10% of portfolio)
A US market ETF (Nasdaq 100 or S&P 500) provides currency diversification and access to global technology companies. The US dollar appreciation against the Indian rupee over long periods (historically 3-4% per annum) adds to returns from underlying index gains. Keep international ETF allocations moderate given SEBI investment limits that can temporarily halt purchases.
Debt Allocation (20-30% of portfolio)
For the fixed-income component, direct plan debt mutual funds (liquid, short duration, or banking and PSU) are typically simpler than debt ETFs for most investors. If you prefer the ETF structure, a Bharat Bond ETF targeting your goal horizon provides a defined-maturity, AAA-rated alternative.
Common ETF Investing Mistakes to Avoid
ETF investing is simple in principle but several errors recur in practice.
Buying Illiquid ETFs
Many ETFs listed in India have very low daily volumes (under Rs 1 crore). Buying a large position in an illiquid ETF means you may not be able to exit at a fair price if you need the money urgently or want to rebalance. Always check the 30-day average daily volume before buying. Stick to ETFs with daily volume above Rs 5 crore unless you are making very small investments.
Ignoring the Premium/Discount to NAV
If an ETF is trading at a 1-2% premium to its iNAV, you are paying 1-2% more than the underlying value. This is particularly common in gold ETFs around budget day or in international ETFs when they are the only way retail investors can access a specific market. Waiting for the premium to narrow or using the equivalent index mutual fund route during premium periods is better than overpaying.
Chasing Thematic ETFs Based on Recent Performance
Sectoral and thematic ETFs often attract investors after they have already delivered strong recent returns. Infrastructure ETFs after a government capex push, defence ETFs after geopolitical events, and IT ETFs after a tech bull market are examples. Buying thematic ETFs based on their trailing 1-year return is classic return-chasing – the catalysts that drove those returns may already be priced in. Recency bias and the availability heuristic drive most thematic ETF overallocation at the wrong time.
Evaluating ETF Quality: How to Compare Before You Buy
Not all ETFs tracking the same index are equal. Small differences in fund management quality, liquidity, and cost structure compound into meaningful return differences over 10-20 years. Here is a framework for comparing ETFs in the same category.
Tracking Error and Tracking Difference
Tracking error measures how much the ETF’s daily returns deviate from the index. A low tracking error (under 0.05% annualized for large liquid ETFs) means the fund closely mirrors the index on a day-by-day basis. Tracking difference measures the cumulative underperformance versus the index over a full year. A tracking difference of -0.02% means the ETF underperformed the index by 0.02% annually – effectively the cost of ownership.
The best ETFs have tracking differences very close to zero or even slightly negative (meaning the ETF marginally outperformed the index, which can happen when securities lending income partially offsets expenses). Check the 3-year and 5-year tracking difference on the AMC’s factsheet or on comparison sites before selecting a Nifty 50 ETF.
Daily Average Volume and Market Depth
Examine the order book depth for the ETF on a trading day. For a liquid ETF like Nifty BeES, you will find tens of thousands of units available to buy or sell within a 0.05% range around the midpoint. For an illiquid sectoral ETF, the order book may have only a few hundred units with a wide bid-ask spread. Institutional market makers continuously provide liquidity for large liquid ETFs, ensuring tight spreads even for large orders.
AUM and Number of Folios
Larger AUM and a high number of investor folios indicate active investor interest and AMC commitment to the product. An ETF with Rs 20,000 crore AUM and 5 lakh+ folios is unlikely to face closure or merger. A niche thematic ETF with Rs 50 crore AUM may be merged or wound up if investor interest wanes, forcing an exit at potentially inconvenient timing. Prefer ETFs from the top-5 AMCs by AUM for core holdings.
ETF Rebalancing and Portfolio Maintenance
One of the significant advantages of ETFs is that they require minimal ongoing management. The index rebalances automatically – you do not need to decide which stocks to add or remove. However, your overall portfolio allocation between asset classes (equity, gold, debt, international) will drift over time as different assets perform differently.
Annual Rebalancing
Review your ETF portfolio annually and compare the current allocation to your target. If equity has grown from 70% to 82% of your portfolio due to strong market performance, rebalance by selling some equity ETF units and adding to debt or gold. This systematic rebalancing forces you to sell high and buy low across asset classes – the opposite of the behavioural tendency to chase recent winners. Behavioural discipline in rebalancing is one of the most underappreciated sources of excess return in a long-term portfolio.
Tax-Efficient Rebalancing
When rebalancing an equity ETF portfolio, be mindful of capital gains tax. If you have held units for over 12 months, LTCG applies at 12.5% above Rs 1.25 lakh exemption. Rebalancing within the annual exemption limit minimizes tax drag. Consider directing new SIP/lumpsum investments into underweighted asset classes rather than selling overweighted ones – “rebalancing by addition” avoids triggering capital gains events while gradually restoring target allocation.
The Rise of ETF Investing in India: Why It Matters Now
The rapid growth of India’s ETF market over the past five years reflects a broader shift in investor sophistication and institutional allocation patterns. EPFO (Employees’ Provident Fund Organisation), India’s largest institutional investor, began allocating to equity ETFs in 2015. By 2025, EPFO’s equity ETF portfolio exceeded Rs 2.5 lakh crore, making it the single largest holder of Nifty 50 and Sensex ETFs in India. This institutional anchor has deepened ETF liquidity and reduced bid-ask spreads for retail investors.
Simultaneously, SEBI’s regulatory push for direct investing and the growth of discount brokers has reduced the barrier to ETF investing. A retail investor with a Zerodha account can now buy a Nifty 50 ETF with a 0.02% expense ratio and approximately Rs 40 in total transaction costs on a Rs 10,000 investment. This cost structure was unavailable to retail investors 10 years ago, when actively managed large-cap mutual funds with 1.5-2% expense ratios were the default.
The data on active fund performance reinforces the ETF case. Research on Indian mutual fund performance consistently shows that 60-70% of actively managed large-cap equity funds fail to beat the Nifty 50 index over 5-year periods after accounting for expenses. This is a global pattern: the S&P SPIVA reports show similar or worse underperformance in US active funds. For the large-cap segment, where companies are extensively researched and stock prices reflect available information efficiently, passive ETFs have a structural cost advantage that compounds into meaningful outperformance over 15-20 years.
This does not mean active management has no role. In mid-cap and small-cap segments, where information is less efficiently distributed, skilled active managers can add value beyond what index tracking provides. A hybrid approach – core portfolio in large-cap ETFs, satellite allocation in actively managed mid/small-cap funds – captures the cost efficiency of passive investing where it matters most while retaining the potential for skilled active management in less efficient market segments.
ETFs for Different Investor Profiles
Not all ETFs are appropriate for all investors. Here is how to match ETF selection to investor profile.
Young Investors (20-35 Years) Building Wealth
A simple 2-ETF portfolio of Nifty 50 ETF (70%) and Nifty Next 50 ETF (30%) provides diversified large and mid-cap Indian equity exposure at minimal cost. Adding a monthly SIP through the broker’s recurring order facility (available on most platforms) creates the systematic investment habit. International ETF exposure (10% in Nasdaq 100) adds global diversification. Early wealth building through low-cost index exposure is the mathematical foundation of financial independence at a younger age.
Mid-Career Investors (35-50 Years) Optimizing Returns
A more complete allocation: 50% broad equity ETFs, 10% factor ETF (momentum or quality), 10% gold ETF, 10% international ETF, 20% short-duration debt fund. The factor ETF provides a systematic tilt toward attributes historically associated with long-run outperformance. Annual rebalancing between the equity and debt/gold components provides the sell-high-buy-low discipline that pure buy-and-hold equity investors miss.
Near-Retirement Investors (50-60 Years) Protecting Capital
Reducing equity ETF exposure to 40% and increasing debt allocation provides capital protection while maintaining inflation-beating returns. Gilt ETFs or Bharat Bond ETFs provide defined-maturity, high-credit-quality fixed income. Gold ETF maintains the inflation hedge. The key shift is reducing volatility exposure 3-5 years before the intended retirement date to avoid the sequence-of-returns risk of a market crash in the final years before you need the money.
Frequently Asked Questions
Can I start ETF investing India with a small amount?
Yes. A single unit of the Nifty BeES (Nippon India Nifty 50 ETF) costs approximately Rs 230-250. You can start with 1 unit and add more as you accumulate savings. The minimum is the price of 1 unit plus brokerage. Compare this to the Rs 500-1,000 minimum for equivalent index mutual funds. For very small amounts (under Rs 5,000), an index mutual fund SIP may be simpler than an ETF because you do not need to worry about lot sizes or market timing.
What is the difference between ETF and mutual fund in India?
ETFs trade on exchanges like shares with real-time pricing, require a demat account, and typically have lower expense ratios. Mutual funds are priced once a day, can be bought directly from the AMC without a demat account, support automatic SIPs, and have slightly higher expense ratios. Both can track the same indices. The choice depends on how you prefer to invest: SIP-based investors generally prefer index mutual funds; lumpsum investors comfortable with exchanges often prefer ETFs.
Are ETFs in India safe investments?
ETFs are as safe as the underlying securities they hold. A Nifty 50 ETF is as risky as the Nifty 50 index – it rises and falls with the index. A Gold ETF is as safe as physical gold. A Debt ETF is as safe as the bonds it holds. ETFs do not add structural risk beyond what the underlying asset carries. The operational risks are low: ETFs are regulated by SEBI, AUM is held in trust, and even if the AMC fails, the underlying securities belong to investors.
How much return can I expect from Nifty 50 ETF India?
The Nifty 50 has delivered approximately 12-13% compound annual returns (CAGR) over 20-year periods in India, including dividends. Individual year returns vary widely: the index has posted both 50%+ and -50% single-year returns. A Nifty 50 ETF delivers the same returns as the index minus the expense ratio (0.02-0.05%). No specific annual return can be guaranteed – equity returns depend on economic growth, corporate earnings, and market valuations over your holding period.
Do ETFs pay dividends in India?
ETFs in India can distribute dividends through the IDCW (income distribution cum capital withdrawal) option. However, most long-term investors choose the growth option, which reinvests dividends back into the fund’s NAV automatically. IDCW payouts are taxable in the year received. For equity ETFs, dividends received by the ETF from underlying stocks are generally reinvested by the fund, and only explicit IDCW distributions from the ETF itself constitute taxable income for the investor.
Related Articles
- SIP vs Lumpsum: 20-Year Backtest Results for Indian Investors
- Digital Gold vs Sovereign Gold Bond vs Gold ETF: Which Is Best?
- 10 Investment Biases That Cost Indian Investors Money