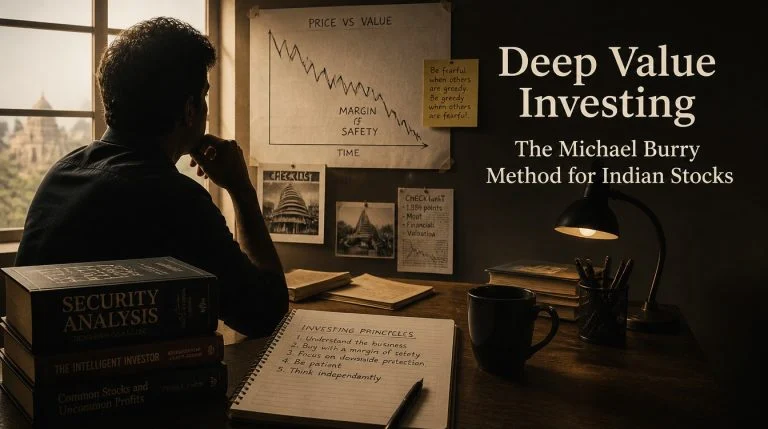

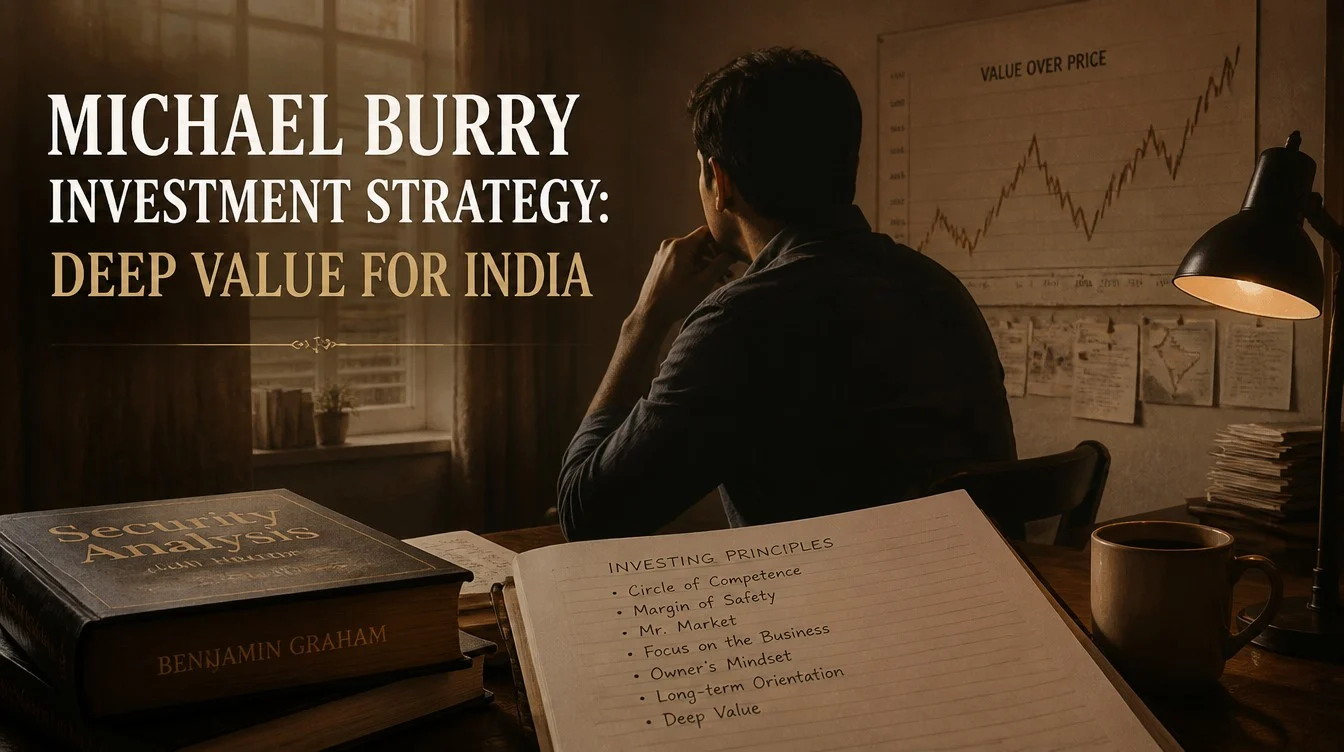
Michael Burry Investment Strategy: Deep Value Investing Explained for Indian Markets
Michael Burry became famous for betting against the US housing market before the 2008 financial crisis, a trade immortalised in the book and film “The Big Short”. But behind the headline trade is a rigorous, disciplined Michael Burry investment strategy built on deep value analysis, contrarian conviction, and an unusual willingness to hold unpopular positions under enormous pressure. For Indian investors, Burry’s approach offers a systematic framework for finding severely mispriced assets in a market where institutional coverage is thin and emotional cycles are sharp.
This guide covers Burry’s complete investment philosophy, the analytical methods he uses to find deep value opportunities, how he researched and executed the housing short, and how every element of his approach can be translated to Indian equities in 2026.
Who Is Michael Burry? The Investor Behind The Big Short
Michael James Burry was born in 1971 in San Jose, California. He lost his left eye to retinoblastoma as a child and grew up with a glass eye – a detail he mentions because he believes his unusual appearance contributed to a lifelong comfort with being socially isolated, which later made it psychologically easier to hold deeply contrarian investment positions that the rest of the market found incomprehensible.
The Self-Taught Investor
Burry trained as a neurologist, completing his residency at Stanford Medical Center. He taught himself investing by reading Benjamin Graham’s Security Analysis, Buffett’s annual letters, and academic papers on valuation. He began posting investment analyses on a financial discussion board called Silicon Investor around 1999-2000. His posts were so detailed and well-reasoned that professional fund managers began tracking them, eventually leading to Joel Greenblatt of Gotham Capital offering him seed funding to launch his own fund.
Scion Capital: The Track Record
Burry founded Scion Capital in 2000 with $1 million of his own money and $1 million from family. From 2001 to 2005, while the S&P 500 fell roughly 6%, Scion returned over 240%. He achieved this by buying deeply discounted, ignored small-cap stocks – companies trading at significant discounts to their liquidation or intrinsic value – using rigorous bottom-up fundamental analysis with no macro overlay.
The 2008 Trade: Scale and Psychology
In 2005-2006, Burry identified that the US subprime mortgage market was built on unsustainable lending standards and that the securitised products built from these mortgages (CDOs and mortgage-backed securities) were catastrophically mispriced relative to the actual default risk they contained. He convinced Goldman Sachs and Deutsche Bank to create credit default swap contracts that would pay out if the mortgage bonds failed. He then convinced his investors to let him buy approximately $1.3 billion in these swaps – a trade that required years of losses before it paid off, nearly tore his fund apart due to investor redemptions, and ultimately produced a profit of roughly $700 million for his investors and $100 million for himself personally.
The Core Michael Burry Investment Philosophy
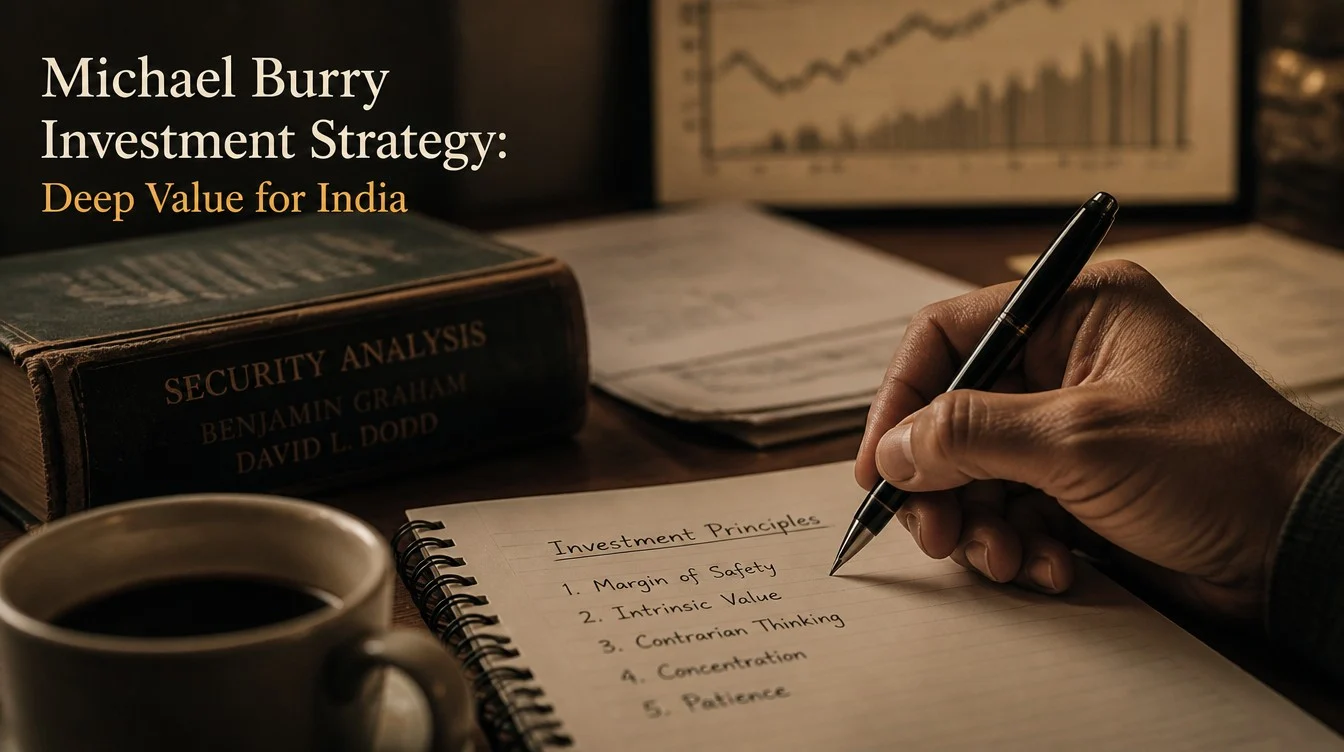
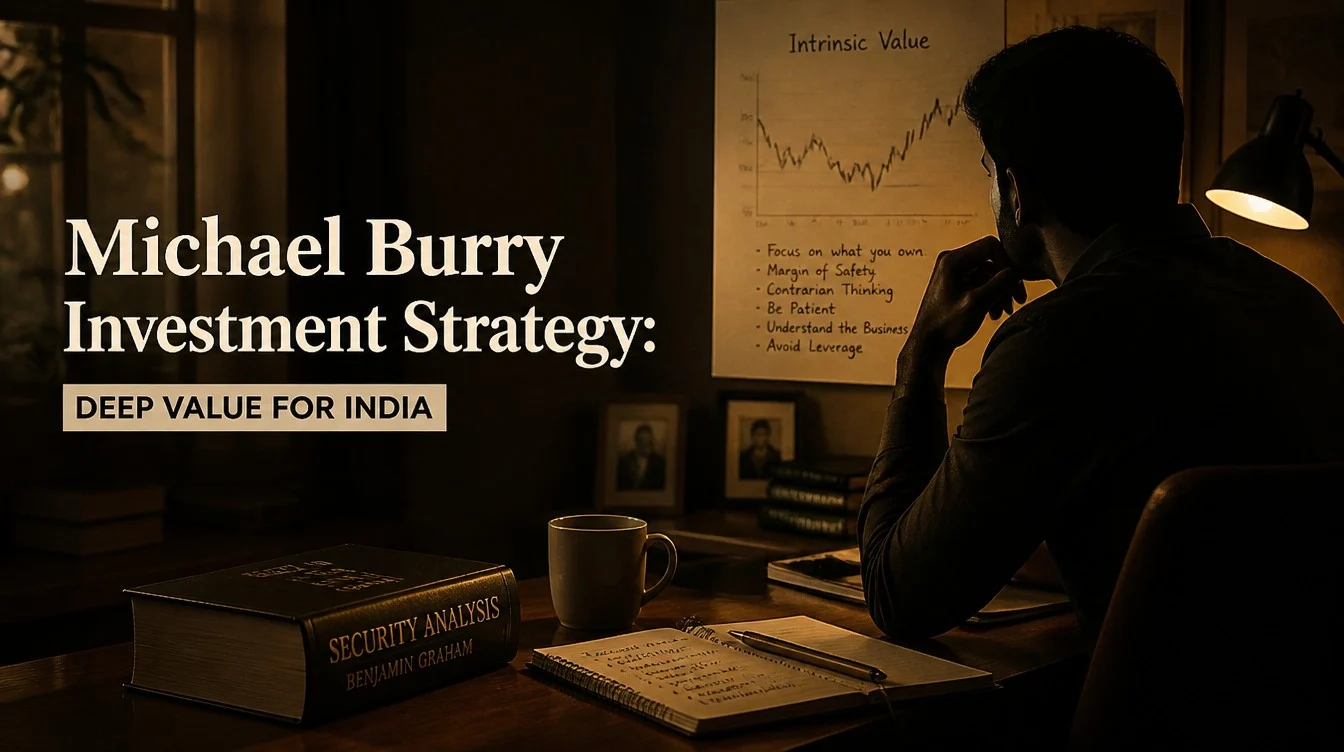
Burry’s investment philosophy is deep value with a contrarian edge. It has five pillars that work together to produce the kind of asymmetric opportunities he seeks.
Pillar 1: Read Everything, Trust Nothing Second-Hand
Burry is famous for reading primary source documents rather than analyst summaries. For the housing trade, he did not read research notes from sell-side analysts covering mortgage companies. He read the actual loan-level data in the bond prospectuses – hundreds of pages of raw data that no one else was bothering to examine. For stock investments, he reads actual SEC filings (10-Ks, 10-Qs, proxy statements), not earnings press releases. In India, the equivalent is reading SEBI filings, DRHP documents, annual reports, and exchange circulars rather than broking research summaries.
Pillar 2: Price Is What You Pay, Value Is What You Get
Like Graham and Buffett, Burry starts from the premise that the stock price and the business value are separate quantities. His analytical goal is to estimate business value as accurately as possible using the primary source documents, then compare that estimate to the current stock price. If the gap between price and value is wide enough (his threshold is typically a 50% or greater discount to his estimate), the investment qualifies for further work. If the gap is narrow, he moves on regardless of how attractive the business looks qualitatively.
Pillar 3: Focus on What Others Are Ignoring
Burry actively seeks investments that are out of favour, misunderstood, or simply too small and illiquid for institutional investors to bother with. His early Scion portfolio was dominated by micro-cap and small-cap stocks in sectors that Wall Street analysts had abandoned. In India, the equivalent hunting ground is the NSE SME platform, small-cap stocks below Rs 1,000 crore market cap that receive no analyst coverage, and out-of-favour sectors where institutional investors have systematically reduced exposure. The fundamentals of value-based investing consistently point to this information gap as the primary source of genuine mispricing.
Pillar 4: The Catalyst Question
Burry does not just find cheap stocks. He asks, ‘What specific event or development will cause the market to recognise the mispricing? A stock can be cheap for years if there is no catalyst to close the gap between price and value. Catalysts he looks for include management changes, activist investor involvement, a corporate restructuring, a sector re-rating, or a regulatory change that improves the business environment. Without a plausible catalyst, a cheap stock may simply stay cheap.
Pillar 5: Psychological Resilience as an Edge
Burry has written and spoken extensively about the psychological demands of contrarian investing. During the housing short, his investors lost faith in him, threatened legal action, and demanded redemptions – all while the trade was losing money mark-to-market before it eventually paid off. His ability to sit with an unpopular position under intense social and financial pressure, without capitulating, was as important as the analytical insight itself. He has since been diagnosed with Asperger syndrome, which he credits partly for his ability to maintain conviction in the face of social disapproval in a way that neurotypical investors find extremely difficult.
Burry’s Deep Value Analytical Framework
Burry’s stock analysis follows a specific sequence that prioritises quantitative screening first and qualitative assessment second – the reverse of how most growth investors operate.
Step 1: Quantitative Screens for Extreme Cheapness
Burry starts with numerical screens to identify companies trading at extreme discounts. His preferred metrics include:
- Price-to-free-cash-flow below 10x – normalised over 3-5 years to smooth cyclical variation
- EV/EBIT below 8x – enterprise value relative to operating earnings, preferred over P/E because it accounts for debt structure
- Price-to-book below 1x – particularly for asset-heavy businesses where book value is a reasonable floor
- Significant share buybacks – management using free cash flow to reduce share count signals confidence and returns cash to patient shareholders
In Indian markets, applying these screens to the NSE small-cap universe typically identifies 20-40 companies at any given time. Most will have obvious reasons for their cheapness – declining businesses, management quality issues, and sector headwinds. The goal is to find the subset where the cheapness is temporary or misunderstood rather than permanent.
Step 2: Balance Sheet Forensics
After identifying quantitatively cheap stocks, Burry examines the balance sheet in extreme detail. Key questions:
- Is the debt manageable? Can the business service its debt through the current cycle without a dilutive equity raise?
- Are the receivables growing faster than revenue? Accelerating receivables growth signals either channel stuffing or customers who cannot pay.
- Is inventory building faster than sales? In product businesses, excess inventory often precedes a write-down.
- What are the contingent liabilities? Lawsuits, tax disputes, and environmental liabilities that are disclosed in footnotes but not on the face of the balance sheet can suddenly become material.
In India, related-party receivables deserve particular scrutiny. A company with Rs 200 crore of receivables from promoter-related entities is not in the same position as a company with Rs 200 crore of receivables from 200 independent customers. Confirmation bias causes investors to overlook these red flags when the headline numbers look attractive.
Step 3: Free Cash Flow Normalisation
Burry’s valuation anchor is normalised free cash flow – the cash the business actually generates for shareholders after all necessary reinvestment, averaged over a full business cycle. He adjusts reported earnings for non-cash items, one-off charges, and cyclically elevated or depressed revenues to arrive at a through-cycle cash generation estimate.
For Indian investors, the most common distortions to adjust for are aggressive capitalisation of expenses that should be expensed (common in infrastructure and technology services), one-time gains or losses from asset sales, and working capital fluctuations that are cyclical rather than structural. A company showing Rs 100 crore profit in a peak cycle year may be generating Rs 40 crore of normalised free cash flow.
Step 4: Liquidation Value as a Floor
For asset-heavy businesses, Burry estimates liquidation value – what the business would be worth if it stopped operating and sold all its assets. This provides a hard floor for valuation: if the stock price is below liquidation value and the company is not actively destroying cash, the downside is structurally limited. This is closest to Graham’s original net-net approach and is most applicable to Indian PSU companies, asset-heavy manufacturers, and real estate developers trading below book.
How The Big Short Was Researched: Lessons for Indian Investors
The housing short trade is the most studied example of Burry’s analytical process. Understanding how he arrived at the trade is as instructive as knowing that he made it.
Reading the Prospectuses
In 2004-2005, Burry began reading the actual prospectuses for mortgage-backed securities. These were hundreds of pages of legal documents that disclosed, in the appendices, the actual characteristics of the underlying loans: loan-to-value ratios, borrower FICO scores, the proportion of no-documentation loans, and geographic concentration. He found that these characteristics were deteriorating dramatically from 2004 to 2006 – loans were being made to borrowers who could not afford them, with minimal documentation, at loan-to-value ratios that assumed permanently rising home prices.
The Insight Nobody Else Had Made
The key insight was not just that the loans were bad – many people in the market sensed this. The insight was that the securities built from these loans were rated AAA by the rating agencies based on models that assumed housing prices would never fall nationally and that default correlations between geographies would remain low. Both assumptions were wrong. When Burry quantified just how wrong they were, the mispricing between the risk embedded in the securities and the price the market was charging for insurance against default was enormous.
The Indian Analogue: Where Are the Unread Prospectuses?
For Indian investors, the lesson is to seek information that is technically public but practically unread. DRHP documents for IPOs contain detailed risk factor disclosures that most retail investors never open. NCLT filing details for companies in insolvency contain asset valuations that may differ dramatically from the traded price of the debt or equity. Bulk deal data and block deal data on BSE/NSE contain information about who is buying and selling large positions that, read carefully over time, can signal informed accumulation or distribution. Regulatory filing databases are public records – the edge is in actually reading them.
Deep Value Investing Applied to Indian Small-Caps
The Indian small-cap universe is where Burry’s early analytical approach – quantitative screening for extreme cheapness, followed by primary document forensics – is most applicable. Here is how to operationalise it.
Where to Screen in India
Screener.in and the NSE/BSE equity screener tools allow filtering by P/E, P/B, EV/EBIT, dividend yield, and free cash flow yield. A practical starting screen for Bury-style deep value in India: market cap between Rs 500 crore and Rs 5,000 crore (small to mid-cap), P/B below 1.5x, EV/EBIT below 10x, positive free cash flow for 3 of the last 5 years, and debt-to-equity below 1x. This typically produces 30-60 candidates. Most will be structurally impaired; the task is to find the handful that are temporarily mispriced.
Sectors Most Likely to Contain Burry-Style Opportunities in India
Deep value opportunities in India tend to cluster in sectors that have undergone severe multi-year drawdowns: the Indian real estate sector from 2014-2020, PSU banks from 2015-2020, telecom from 2016-2020, and certain chemicals and speciality materials sectors during global pricing downturns. The pattern is consistent: a sector undergoes a brutal cycle due to over-leverage, regulatory change, or demand collapse; institutional investors exit; valuations fall to levels that discount permanent impairment rather than temporary stress. The deep value investor’s task is to identify which companies in the sector will survive and emerge stronger.
The Burry Checklist for Indian Small-Caps
Before adding any deep value small-cap to a watchlist, answer these questions from the annual report and SEBI filings:
- Does the promoter hold a meaningful equity stake (above 40%)? Promoter skin in the game is the single most important governance signal in Indian small-caps.
- Has the promoter been buying stock in the open market in the past 12 months? Open market purchases are the strongest signal of promoter conviction.
- Is the company generating positive operating cash flow? A consistently cash-generative business can survive a prolonged market downturn; one that consumes cash cannot.
- Are there related-party transactions above 5% of revenue? If yes, read the transaction details carefully – are they at arm’s length, or do they represent value extraction from minority shareholders?
- Is the auditor from a reputable firm, and is the audit report clean? An emphasis-of-matter paragraph or a qualified opinion is a hard stop – exit the analysis.
- Can you identify a specific catalyst that will cause the market to re-rate this stock in the next 2-3 years?
Burry’s Current Macro Views and What They Mean for Indian Investors
Burry remains an active investor and public commentator on macro conditions. His publicly disclosed portfolio positions (via SEC 13F filings, updated quarterly) and his occasional social media posts provide insight into his current concerns.
The Passive Investing Bubble Thesis
Burry has argued that the massive growth in passive index investing has created a systematic mispricing in markets: large-cap stocks included in major indices are overpriced because passive flows automatically buy them regardless of valuation, while small-cap stocks outside the indices are underpriced because the same passive flows ignore them. This thesis, if correct, directly supports a deep value approach to the Indian small-cap universe – the stocks that Burry-style analysis would surface are precisely those that passive flows are not touching.
Inflation and Hard Asset Concerns
Burry has been vocal about inflation risks and the potential for currency debasement in the context of massive global debt levels. His portfolio disclosures have included positions in physical assets, resource companies, and short positions on government bonds. For Indian investors, the inflation hedge implication aligns with the All-Weather framework: gold, commodity exposure, and real assets deserve a structural allocation, not just a tactical one. Gold as an investment in India is consistent with both Dalio’s and Burry’s current macro positioning.
The Water Scarcity Investment Theme
One of Burry’s most publicised investment theses involves water scarcity. He has argued that water, as a finite resource with rising demand driven by population growth and climate change, represents one of the most underpriced commodities of the 21st century. He reportedly invested in farmland with water rights in California as a direct expression of this thesis. In India, the water scarcity angle maps to companies involved in water treatment, irrigation infrastructure, and groundwater management – a niche but growing investable universe.
Burry’s Early Scion Portfolio: What He Actually Bought and Why
The housing shortage dominates Bury’s public image, but his early Scion Capital portfolio from 2001 to 2005 is the more instructive period for retail investors. It shows the deep value methodology applied to individual equities – the work that built Scion’s 242% return while the S&P 500 fell 6%.
The Types of Stocks Scion Held Early On
Burry’s early Scion holdings were concentrated in three types of businesses:
- Asset-rich companies trading below book value. Businesses with significant tangible assets – real estate, inventory, and receivables – whose stock price implied those assets were worth less than their actual market value. These are pure Graham-style net-net plays.
- Ignored small-caps with consistent free cash flow. Companies too small for institutional coverage, generating genuine cash, run by owner-operators who were buying back stock. The combination of size neglect and insider buying created a dual catalyst: institutional discovery over time and share count reduction accelerating per-share value.
- Out-of-favour sector survivors. After the dot-com bust, dozens of profitable, cash-generative technology services businesses were trading as if they were about to go bankrupt alongside the truly failed dot-coms. Burry read their balance sheets and identified those with net cash, positive cash flow, and viable business models – and bought them at prices that implied imminent failure.
The Analytical Time Investment
Burry has described spending 50+ hours analysing a single investment before initiating a position. For the average Indian retail investor managing a day job alongside a portfolio, this level of depth is not realistic across 20+ positions. The practical adaptation is to apply this depth to your highest-conviction positions – the 3-5 stocks where you take meaningful position sizes – and use simpler, index-based instruments for the rest. Deep value analysis produces the most alpha on concentrated, high-conviction positions where the work genuinely informs the decision. It produces very little alpha across 30 positions, where each gets 2 hours of analysis.
Position Sizing at Scion
Burry sized positions based on the quality of the opportunity, not on diversification formulas. When he had very high conviction – the analytical work was thorough, the discount was extreme, and the catalyst was clear – he took large positions. His top 10 holdings typically represented 60-70% of the portfolio. This is aggressive even by professional standards. For Indian retail investors, a practical adaptation is to hold 8-12 positions, with your top 4-5 representing 50-60% of equity exposure – concentrated enough to generate meaningful alpha from your best ideas and diversified enough to survive a single catastrophic governance failure.
Exit Discipline: Burry Sells When the Thesis Completes
Unlike Buffett, who holds forever, Burry is a trader at heart – he enters when value is extreme and exits when the discount to intrinsic value closes. Once a stock reaches his estimate of fair value, he sells, regardless of how good the business is or how much momentum exists. This discipline prevents him from overstaying his welcome in value traps that re-rate to fair value and then decline further. For Indian investors applying deep value, the exit criterion should be defined at entry: “I will sell when the stock reaches X, which represents my estimate of intrinsic value.” Writing this number down at purchase removes the emotional complexity of the exit decision.
The Psychological Demands of Burry’s Approach: Can You Actually Do This?
Burry’s strategy produces exceptional returns when it works. It also produces extended periods of severe underperformance, investor hostility, and social isolation that most investors underestimate when they study his track record.
The Cost of Being Early
Burry’s housing shortage was analytically correct from approximately 2005. It did not pay off until 2007-2008. During the intervening period, the trade lost money mark-to-market every quarter. His investors demanded redemptions. His board tried to remove his discretion over the trade. He locked up the fund’s assets – a decision that was legally permissible but destroyed his relationship with almost every investor. Being right but early is functionally identical to being wrong until it is not, and most investors cannot survive the psychological and financial cost of that gap.
Concentration and Conviction
Burry runs highly concentrated portfolios. His Scion Capital at various points held fewer than 20 positions, with the top 5 representing the majority of assets. The housing short represented approximately 30% of the fund. This concentration is only rational when the analytical work is deep enough to justify the conviction – and only psychologically sustainable for investors who are genuinely comfortable with their positions being down 30-40% before they recover. Systematic investment approaches may be more suitable for investors who cannot sustain this level of portfolio concentration and drawdown tolerance.
The Asperger Advantage – and Its Costs
Burry has been candid that his Asperger diagnosis, while creating social difficulties, gave him analytical advantages: an ability to hyperfocus on complex data sets for extended periods, a reduced susceptibility to social proof (he genuinely did not care that everyone else in the market thought he was wrong), and a preference for primary source material over social consensus. Most investors cannot fully replicate these characteristics. What they can do is build structural discipline into their investment process – mandatory cooling-off periods before selling a position under pressure, written investment theses that must be formally updated before a position can be exited, and pre-defined holding periods that survive short-term volatility.
Common Mistakes When Attempting Burry-Style Deep Value in India
Confusing Cheapness with Value
The most common mistake: buying stocks that screen as cheap without completing the balance sheet forensics. A stock at 0.5x book value is not a Burry opportunity if the book value consists of overvalued assets, the business is consuming cash, and the promoter is selling shares. The screen is a starting filter, not a conclusion. Most cheap stocks are cheap for reasons that are obvious on closer examination.
Ignoring Governance in Favour of Valuation
Indian small-cap investing has produced spectacular frauds that all looked cheap on standard valuation metrics before the fraud was discovered: IL&FS, DHFL, Yes Bank, and Satyam. Burry would not invest in these because his primary document forensics – reading the auditor’s notes, the related-party disclosures, and the cash flow statements relative to reported profits – would have revealed the inconsistencies. Cheap stocks with governance red flags are not opportunities; they are traps.
No Catalyst Identified
Buying a cheap stock without a specific, time-bound catalyst is a common deep value error. The catalyst does not need to be certain – it needs to be plausible and identifiable. “The market will eventually recognise this value” is not a catalyst. “This company’s new management team is buying back stock aggressively and has guided for a debt-free balance sheet within 18 months” is a catalyst.
Frequently Asked Questions
What is Michael Burry’s investment strategy?
Burry’s strategy is deep value investing: identifying companies trading at severe discounts to intrinsic value through rigorous primary-source analysis of financial filings, balance sheet forensics, and free cash flow normalisation. He focuses on ignored, out-of-favour stocks that institutional investors have abandoned, seeks a margin of safety of at least 50% between price and his estimate of intrinsic value, and requires a specific catalyst to close the price-value gap. His psychological edge is an ability to hold deeply contrarian positions under intense pressure for extended periods.
How did Michael Burry predict the 2008 financial crisis?
Burry read the actual loan-level data in subprime mortgage-backed security prospectuses starting in 2004-2005. He found that loan quality had deteriorated dramatically – high loan-to-value ratios, minimal documentation, and teaser rate structures that would reset to unaffordable levels. He then determined that the securities built from these loans were rated AAA based on models that assumed housing prices would never fall nationally, an assumption he could falsify using historical data. When he quantified the gap between the default risk embedded in the securities and the cost of insurance against default, the trade was obvious to him even as it was invisible to almost everyone else in the market.
Can Burry’s deep value approach work in Indian markets?
Yes, particularly in the small-cap and mid-cap universe where institutional coverage is thin and emotional selling produces extreme discounts during sector downturns. The Indian market has produced multiple deep value cycles – PSU banks in 2015-2020, real estate in 2014-2020, and telecom in 2016-2020 – where primary document analysis of surviving companies would have identified misvalued assets well before institutional re-rating. The governance filter is more critical in India than in developed markets due to a higher base rate of promoter-driven value extraction.
What stocks does Michael Burry own now?
Burry’s US-listed positions are disclosed quarterly via SEC 13F filings, typically with a 45-day lag. His portfolio tends to be highly concentrated (fewer than 20 positions), rotates rapidly, and often includes put options that do not appear in 13F disclosures. The positions disclosed should be treated as a starting point for research, not as recommendations to copy – by the time the filing is public, Burry may have already exited the positions. His analytical process matters more than his current holdings.
What is the difference between Burry’s approach and Warren Buffett’s?
Both are value investors, but their focus differs significantly. Buffett emphasises business quality – moats, management, and compounding returns over decades. He is willing to pay a fair price for a wonderful business. Burry emphasises price – he wants to buy businesses (often mediocre ones) at such steep discounts that the margin of safety is enormous regardless of business quality. Burry’s approach produces higher turnover (he exits when the discount closes) and requires more analytical work per investment. Buffett’s approach produces lower turnover and compounds more smoothly. For most Indian retail investors, Buffett’s quality-and-hold approach is more practically sustainable.
Related Articles
- Warren Buffett Investment Strategy: Value Investing for India
- Investment Psychology: 10 Biases That Cost You Money
- Investing 101: Investment Basics to Build Wealth from Scratch